PVT Lab Data
PVT Lab Data: On the PVT lab data tab, you can enter well test results to make the calculation of the PVT properties more accurate. The tab consists of a single pane called…
On this page
On the PVT lab data tab, you can enter well test results to make the calculation of the PVT properties more accurate.
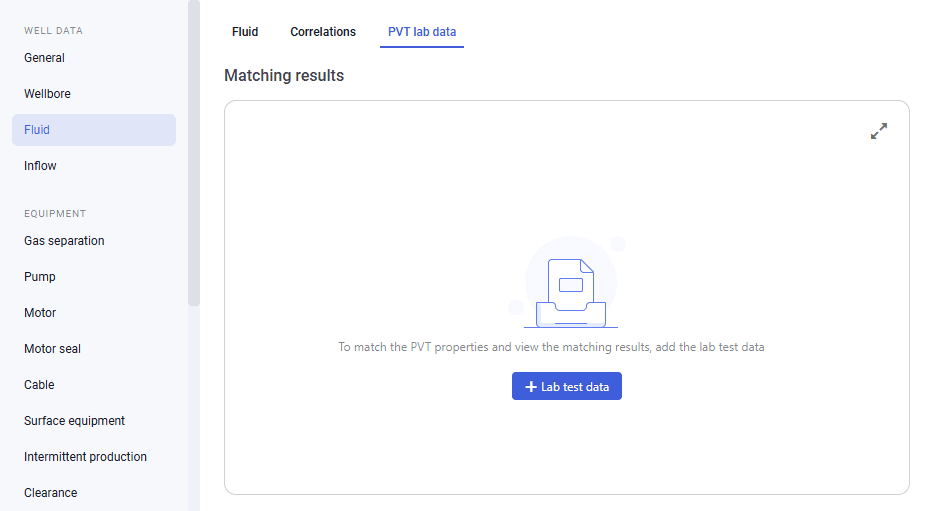
The tab consists of a single pane called Matching results. When you first open the tab and there is no data added, the pane is empty.
 Select image to enlarge
The well test results are added in the Lab test data window that you can open by clicking
+#
Lab test data ( ). For details, see Lab Test Data.
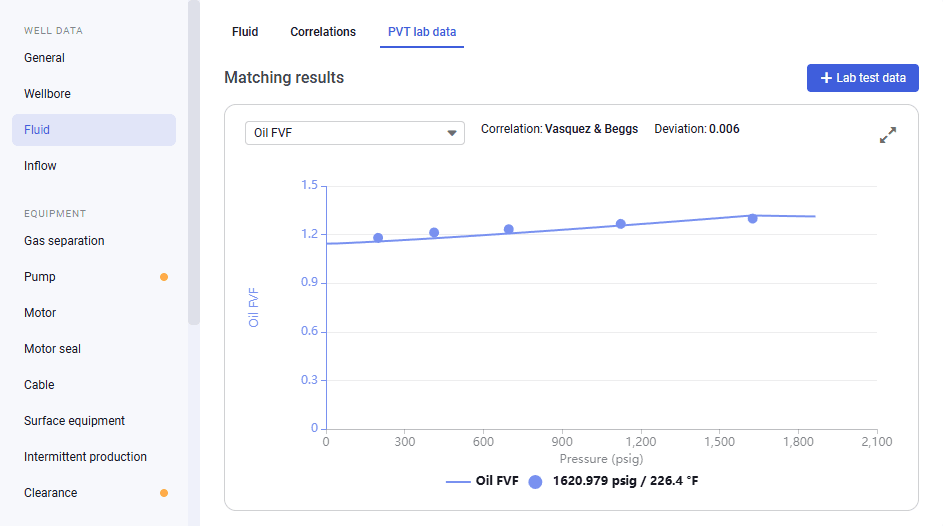
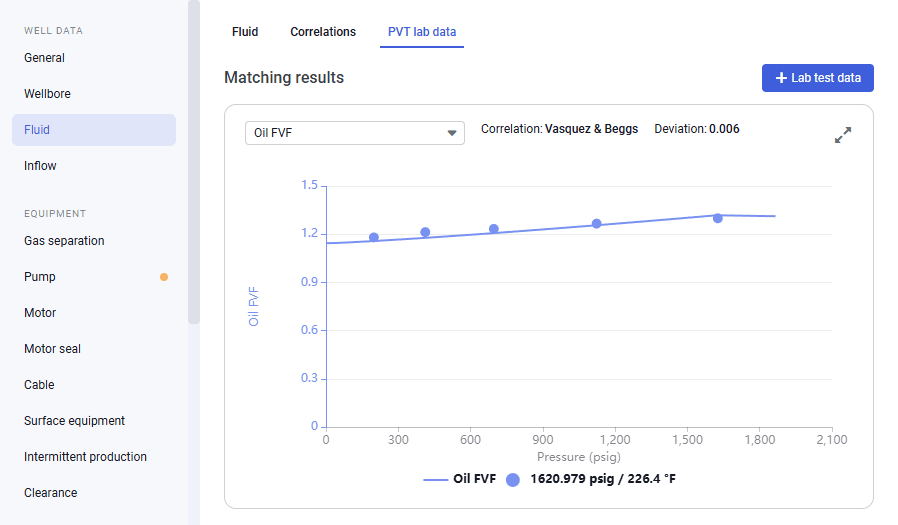
When all the data is added, a chart representing the matching results is displayed in the central part of the tab. For details on the matching procedure, see Matching PVT Properties.
 Select image to enlarge
To show or hide a parameter on the chart, click the parameter name under it.
You can also expand the chart to full screen or collapse it back to the original size using the Expand (  ) / Collapse (
  ) buttons located in the upper-right corner of the chart.
At the top of the chart the following data is displayed:
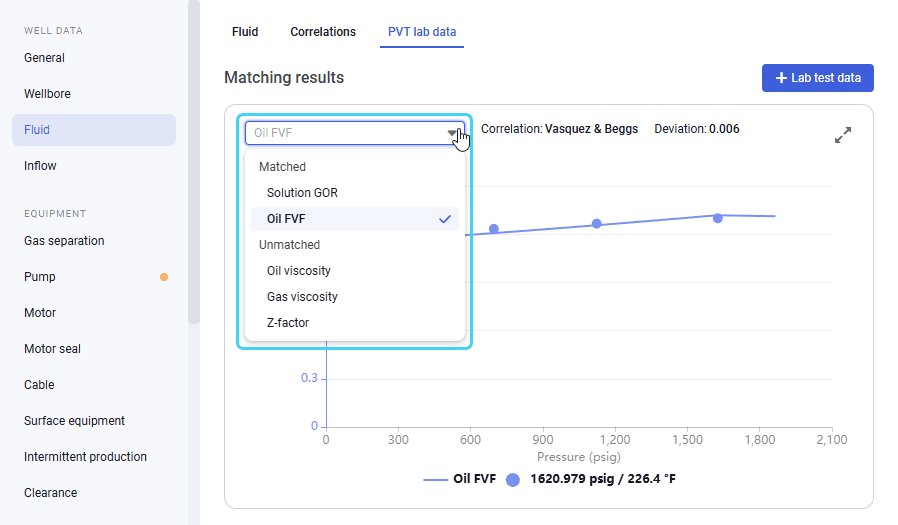
Parameter list#
Provides a list of matched and unmatched parameters that you can select to display the corresponding chart on the tab.
 Select image to enlarge
Correlation#
Name of the correlation that is used for calculation of the parameter selected from the list on the right. For details, see Correlations.
Deviation#
Standard deviation that indicates how much the measured data deviate from the values calculated by the correlation. The smaller the deviation, the more accurately the correlation represents the laboratory test data.
Apply to calculations#
If selected, the obtained matching results replace the corresponding values on the Fluid tab and become unavailable for editing there.
+#
Lab test data ( )#
Opens the window for adding and editing the laboratory test data based on which the PVT property matching is performed. For details, see Lab Test Data.
5.2.3.3.1. Lab Test Data#
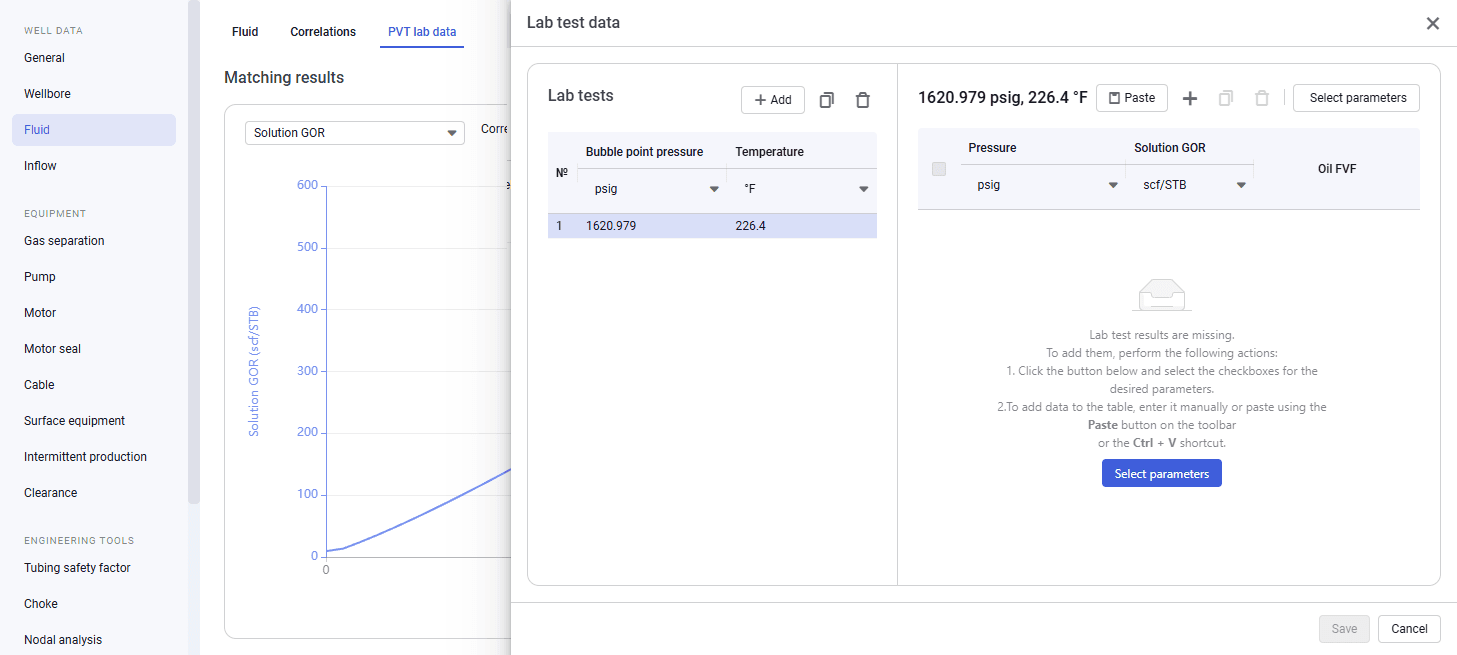
The Lab test data window provides the ability to add results of the well tests to match the results of the PVT property calculation to actual data.
+#
To open the window, on the PVT lab data tab of the Fluid section, click Lab test data ( ).
 Select image to enlarge
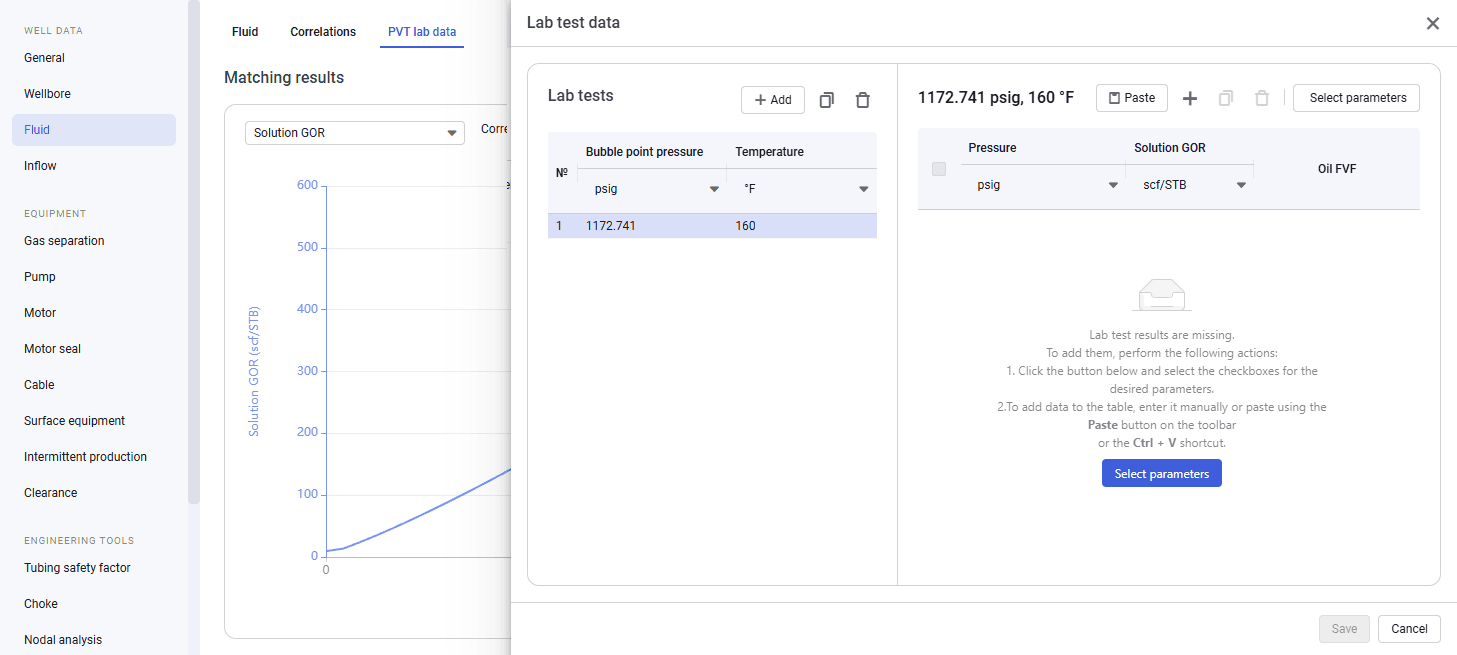
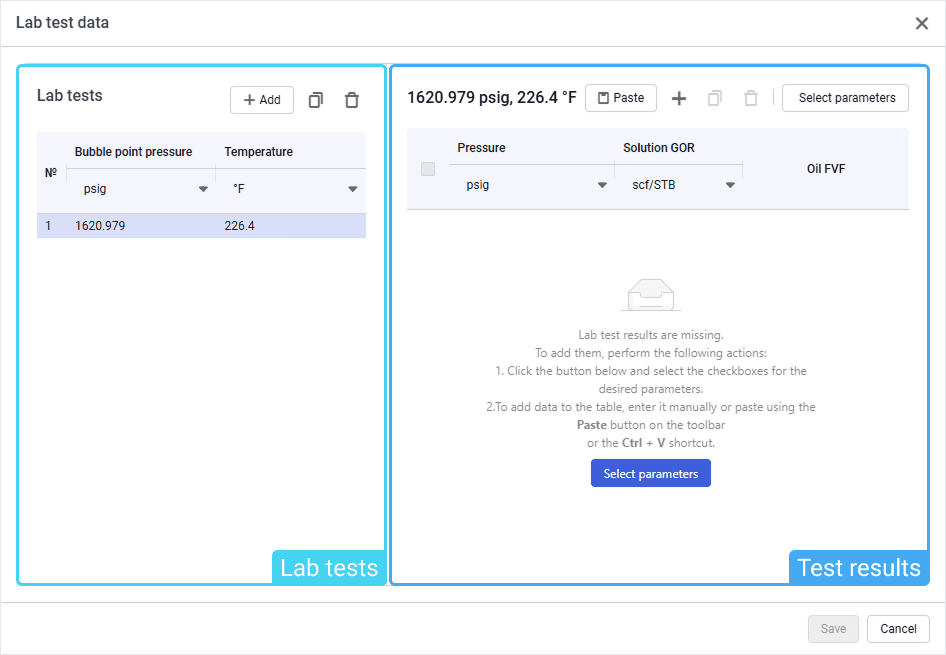
The Lab test data window that opens consists of the following parts:
-
Lab tests table in the left side of the window.
-
Test results table in the right side of the window.
 Select image to enlarge
Lab Tests#
The Lab tests table contains a list of the laboratory tests that were conducted on the well and the results of which will affect the PVT property calculation.
The first entry in the table is added by default, the Bubble point pressure value is pulled from the Fluid tab of the Fluid section, the Temperature value is pulled from the Heat transfer tab of the Wellbore section.
At the top of the table, the following controls are available:
Add (  )#
)#
Adds a new row to the table for adding a lab test. For details, see Matching PVT Properties. You can enter data to the tables manually or paste it from another source using the Ctrl+V shortcut. The source table must have the same column configuration as the target one.
Duplicate (  )#
)#
Creates a copy of the selected row.
Delete (  )#
)#
Deletes the selected row from the table.
Tests Results#
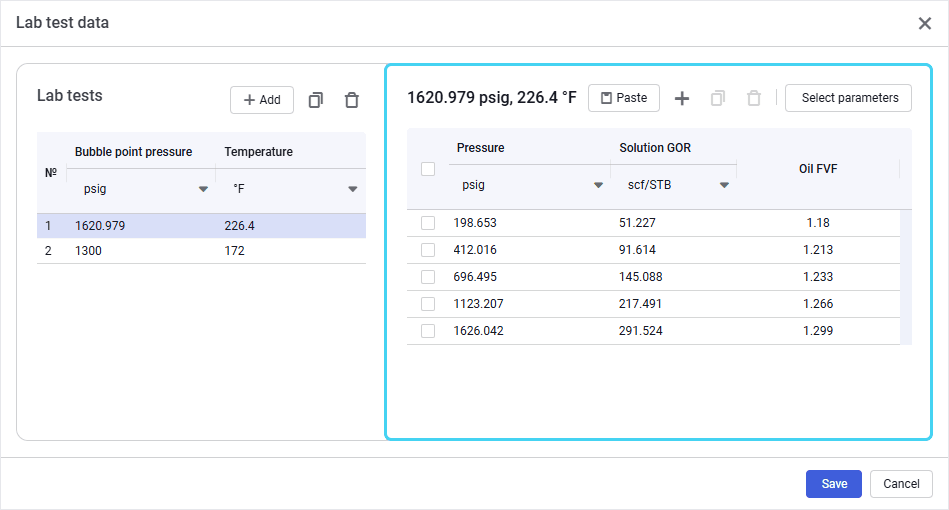
The Test Results table provides the ability to enter parameter values obtained during the laboratory test selected in the Lab tests table on the right.
 Select image to enlarge
To add the data, first, you need to select the parameters values of which were measured by the test (see description below).
At the top of the table, the following controls are available:
Paste (  )#
)#
Pastes data from the clipboard to the table. You can paste more than one row at the same time. The header row of the source table must not be pasted. Alternatively, to paste data, you can use the Ctrl+V shortcut.
Note
The inserted data must contain numerical values only. If the data includes a row with NaN (not a number) values, delete them after insertion.
Add ( )#
Adds a new row to the table for adding values of the parameters measured by the selected test. For details, see Matching PVT Properties.
Duplicate ( )#
Creates a copy of the selected row.
Delete ( )#
Deletes the selected row from the table. To select a row, select the corresponding check box in the leftmost column of the table.
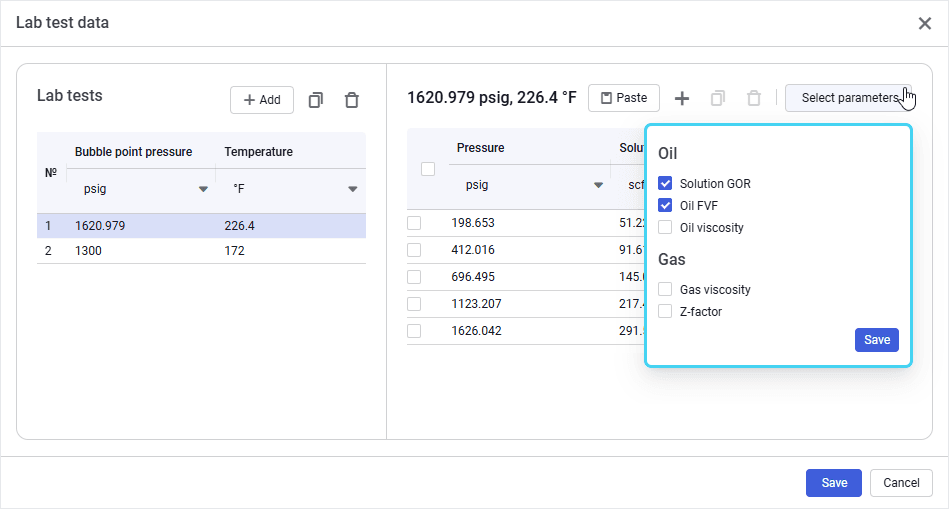
Select parameters ( )#
Provides the ability to select parameters measured by the test. To add or remove a parameter from the table, select or clear the corresponding check box.
 Select image to enlarge
Added parameters are displayed as columns in the Test results table.
5.2.3.3.2. Matching PVT Properties#
To match the well fluid PVT properties to actual data, perform the following actions:
-
Open the nv.design module. For details on navigation in the system, see System Interface.
-
In the left part of the working area, in the list of the module sections, click Fluid, and then go to the PVT lab data tab.
 Select image to enlarge
+#
-
In the central part of the tab, click Lab test data ( ). The Lab test data window opens with the default entry created in the Lab tests table.
 Select image to enlarge
 -
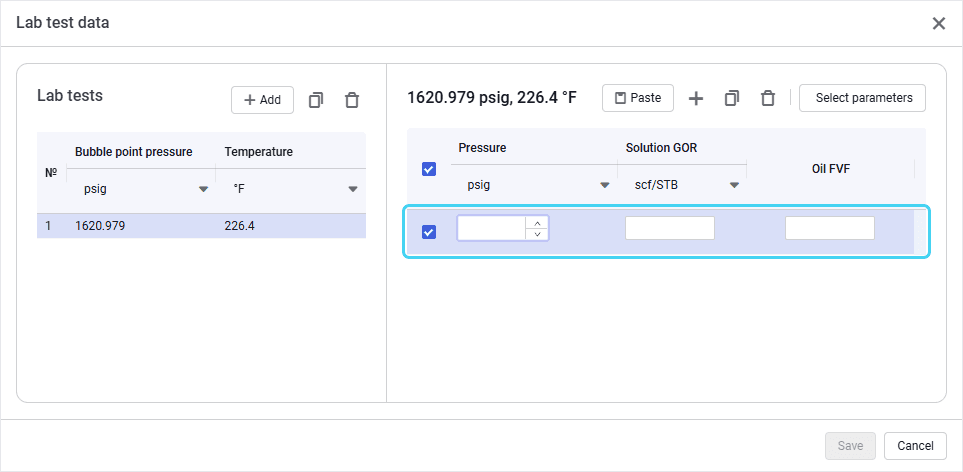
In the right part of the Lab test data window, click Select parameters, select check boxes of the parameters that you want to include in the lab test data, and then click Save.
 Select image to enlarge
 -
To enter values of the selected parameters, perform one of the following actions:
-
Above the table, click Add (
), and then, in the new row, enter the test results. Select image to enlarge
 -
To paste data from another table, copy it to the clipboard, and then click Paste (
 ) above the table or press Ctrl+V. The copied entries appear in the table.
Note
The inserted data must contain numerical values only. If the data includes a row with NaN (not a number) values, delete them after insertion.
-
To create a copy of an existing entry, select the entry that you want to copy in the table, and then, above the table, click Duplicate (
). The duplicated entry appears in the table.
-
-
Add more test results in the same way.
-
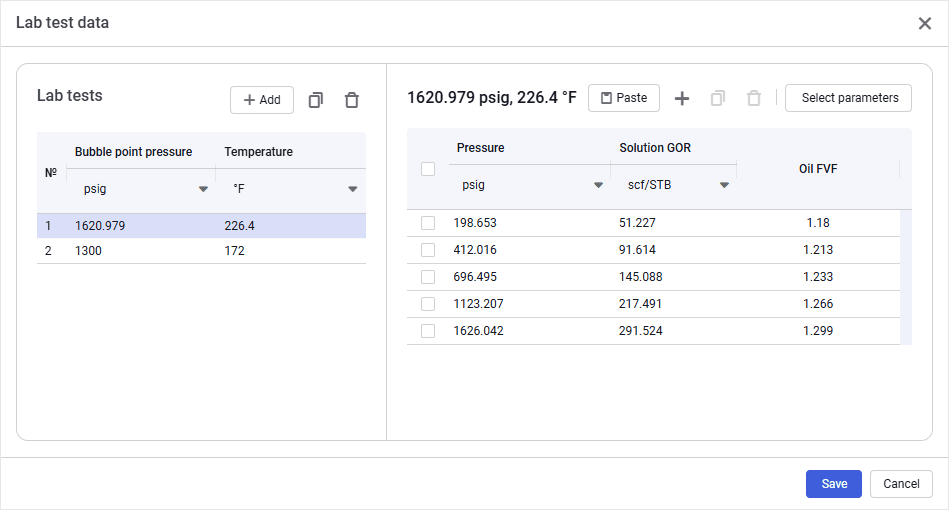
(Optional) To add more laboratory tests, above the Lab tests table, click Add (
), enter the well test conditions (bubble point pressure and temperature) in the new row, and then repeat the previous steps for adding the well test results. Select image to enlarge
 -
After you enter all the data, in the lower-right corner of the window, click Save. The chart representing matching results is displayed in the central part of the tab. For details, see PVT Lab Data.
 Select image to enlarge
 -
To apply the obtained matching results to the well design, in the upper-right corner of the tab, select the Apply to calculations check box.