
Configuration of sections in this group depends on the artificial lift type selected in the Well Information section. For details, see Well Data.
For ESP, the group consists of the following sections:
- Gas separation
- Pump
- Motor
- Motor Seal
- Cable
- Transformer and Controller
- Cycle well
- Clearance
Gas Separation
The Gas separation section provides information about the separation parameters at the pump intake.
The section consists of the following parts:
- Natural Separation parameter group in the left part of the section.
- Gas separator parameter group in the left part of the section.
- Separation Data pane in the right part of the section.
 | Important Pump section models and target parameters such as surface rate and pump frequency from the section. Target tubing head pressure from the section. |
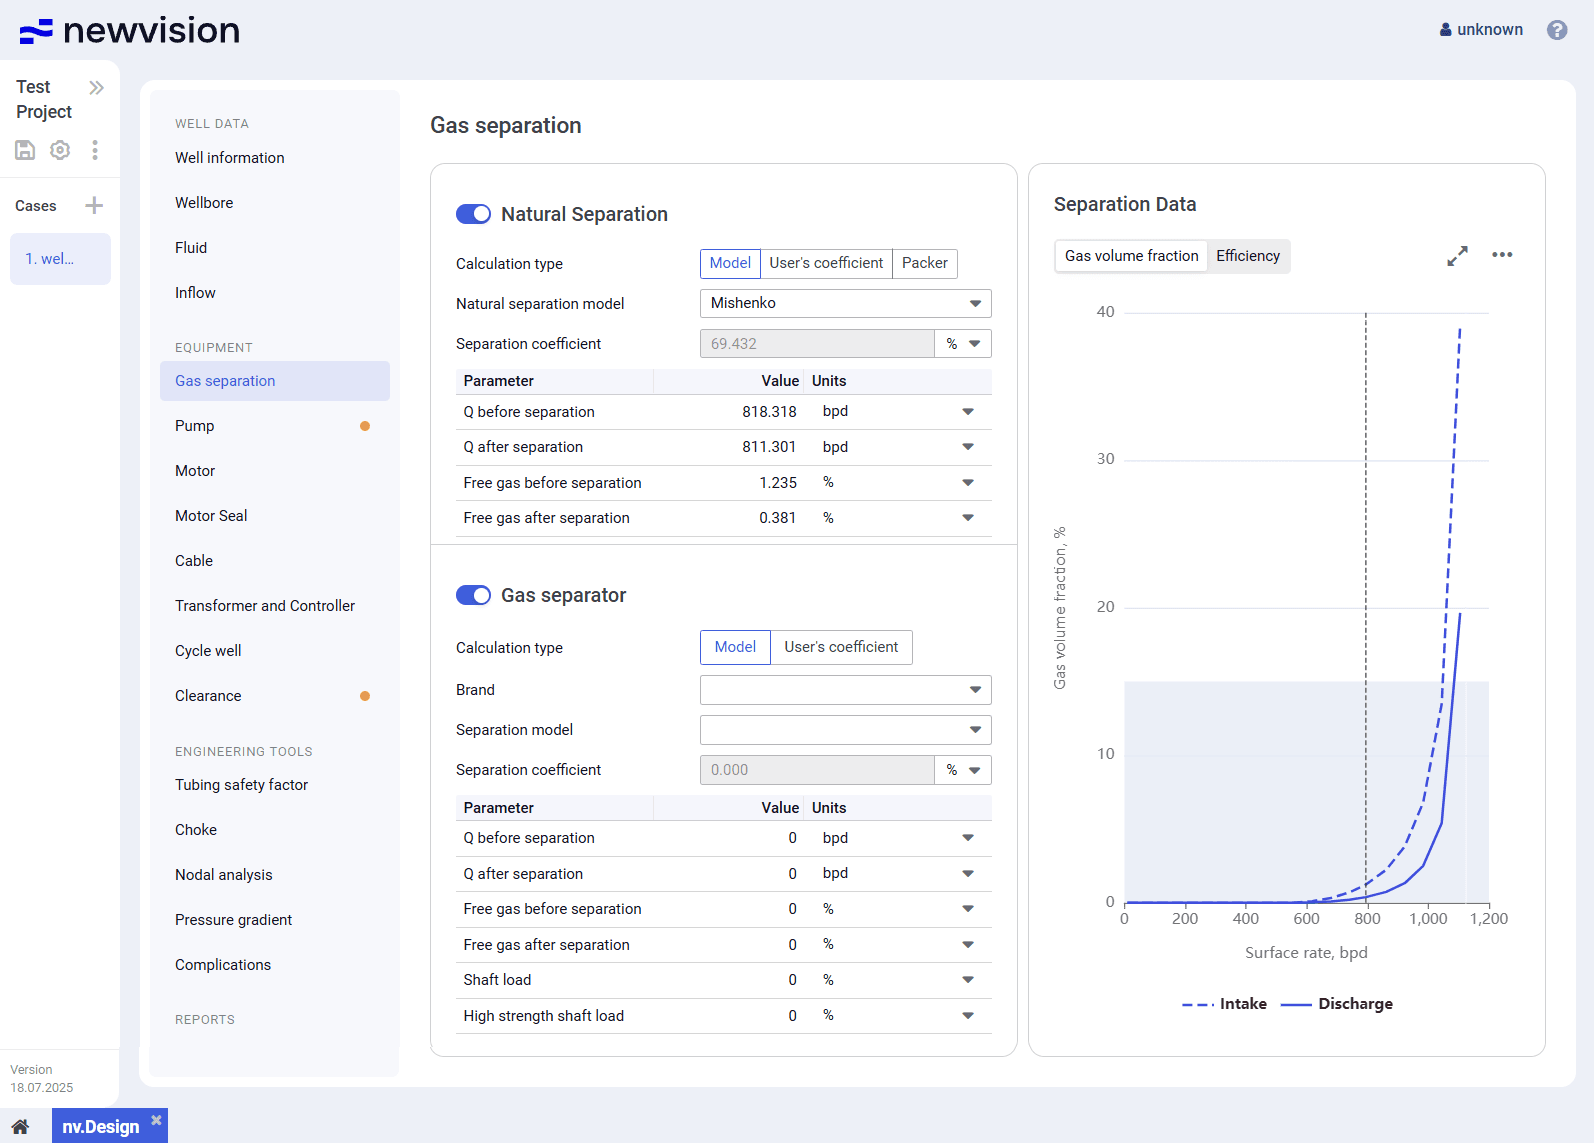
Natural Separation
This parameter group provides controls for configuring the natural separation parameters.
To enable or disable natural separation, use the toggle to the left of the group name.
 | Note |
You can select one of the following calculation methods:
- Model: Calculation using one of the pre-defined models.
You can select the model from the Natural separation model list:
Mishenko: Simplified approach where key physical forces, such as friction and gravity are treated with limited detail. Instead, the model focuses on the representation of phase transitions, particularly the release of gas from oil within the wellbore.
It is commonly used under relatively simple well conditions and is especially effective when assessing gas liberation dynamics prior to surface separation equipment.
Alhanati: Comprehensive description of multiphase flow physics. The model is designed for scenarios where complex phase interactions must be considered. It is particularly suitable for directional and vertical wells, as it accounts for wellbore inclination, gravitational segregation, and phase slip.
Due to its higher accuracy, this model is typically applied in challenging operating environments where realistic modeling of fluid behavior in the wellbore is critical for performance optimization.
- User’s coefficient: Calculation using a custom user-defined coefficient.
You can enter it in the Separation coefficient field. - Packer: Calculation via simulation of a packer.
Below these controls, there is a table with the values of the flow rate (Q) and free gas content before and after separation.
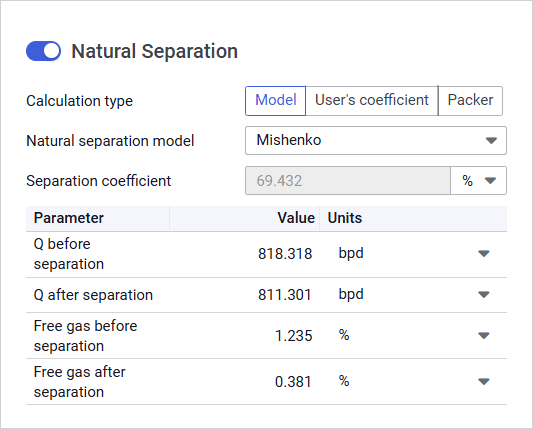
Gas Separator
This parameter group provides controls for configuring the separation parameters if a gas separator is used.
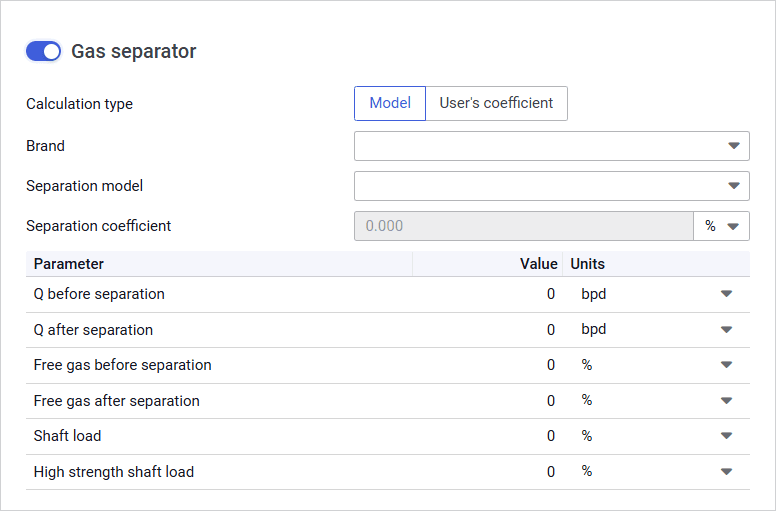
To enable or disable mechanical separation, use the toggle to the left of the group name.
You can select one of the following calculation methods:
- Model: Calculation based on the specific gas separator model parameters.
You can select the separator by selecting its manufacturer and model from the Brand and Separation model lists respectively. - User’s coefficient: Calculation using a user-defined coefficient.
You can enter it in the Separation coefficient field.
Separation Data
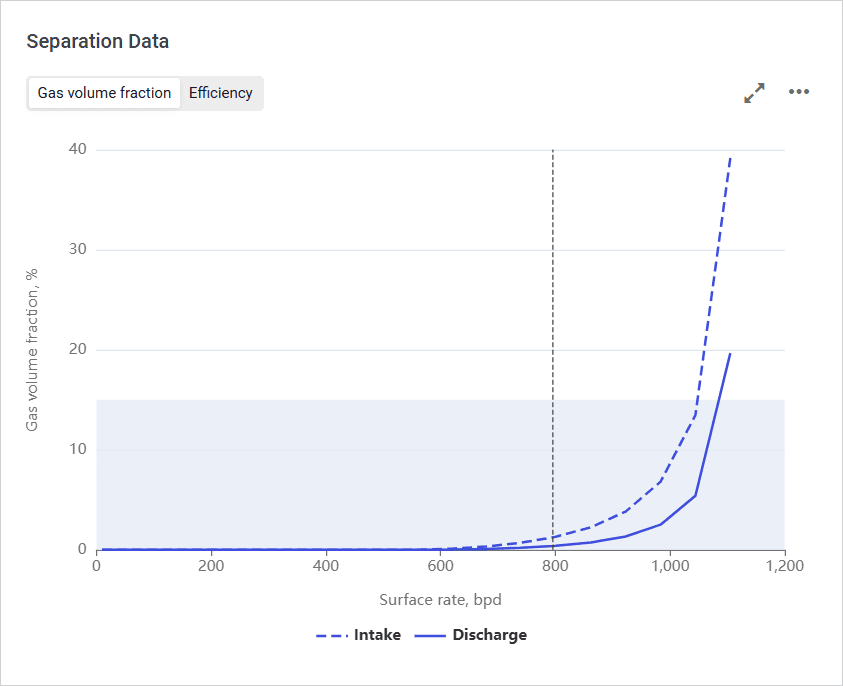
The pane provides visualization of the separation characteristics based on the parameters configured in the Natural Separation and Gas separator parameter groups (see description above).
The pane consists of two tabs:
- Gas volume fraction: Chart representing values of the gas volume fraction at intake and discharge depending on the surface flow rate.
- Efficiency: Chart representing total, natural and/or mechanical separation efficiency depending on the surface flow rate.
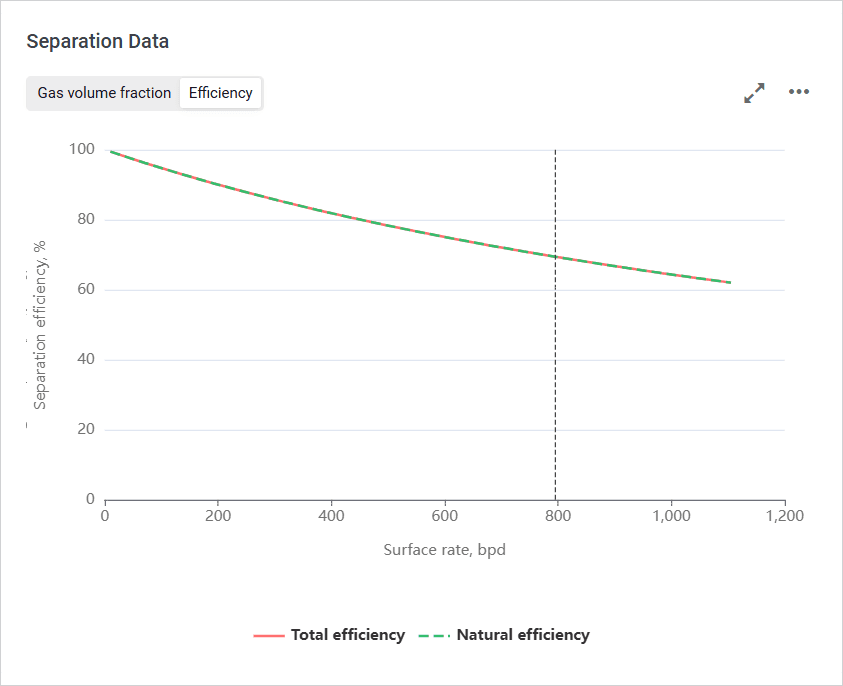
To show or hide a parameter on the chart, click the parameter name under it.
On hovering over any point on the chart, a window with information about the exact parameter values at this point is displayed.
You can also expand the pane to full screen or collapse it back to the original size using the Expand ( ) / Collapse ( ) buttons located in the upper-right corner of the pane.


Pump
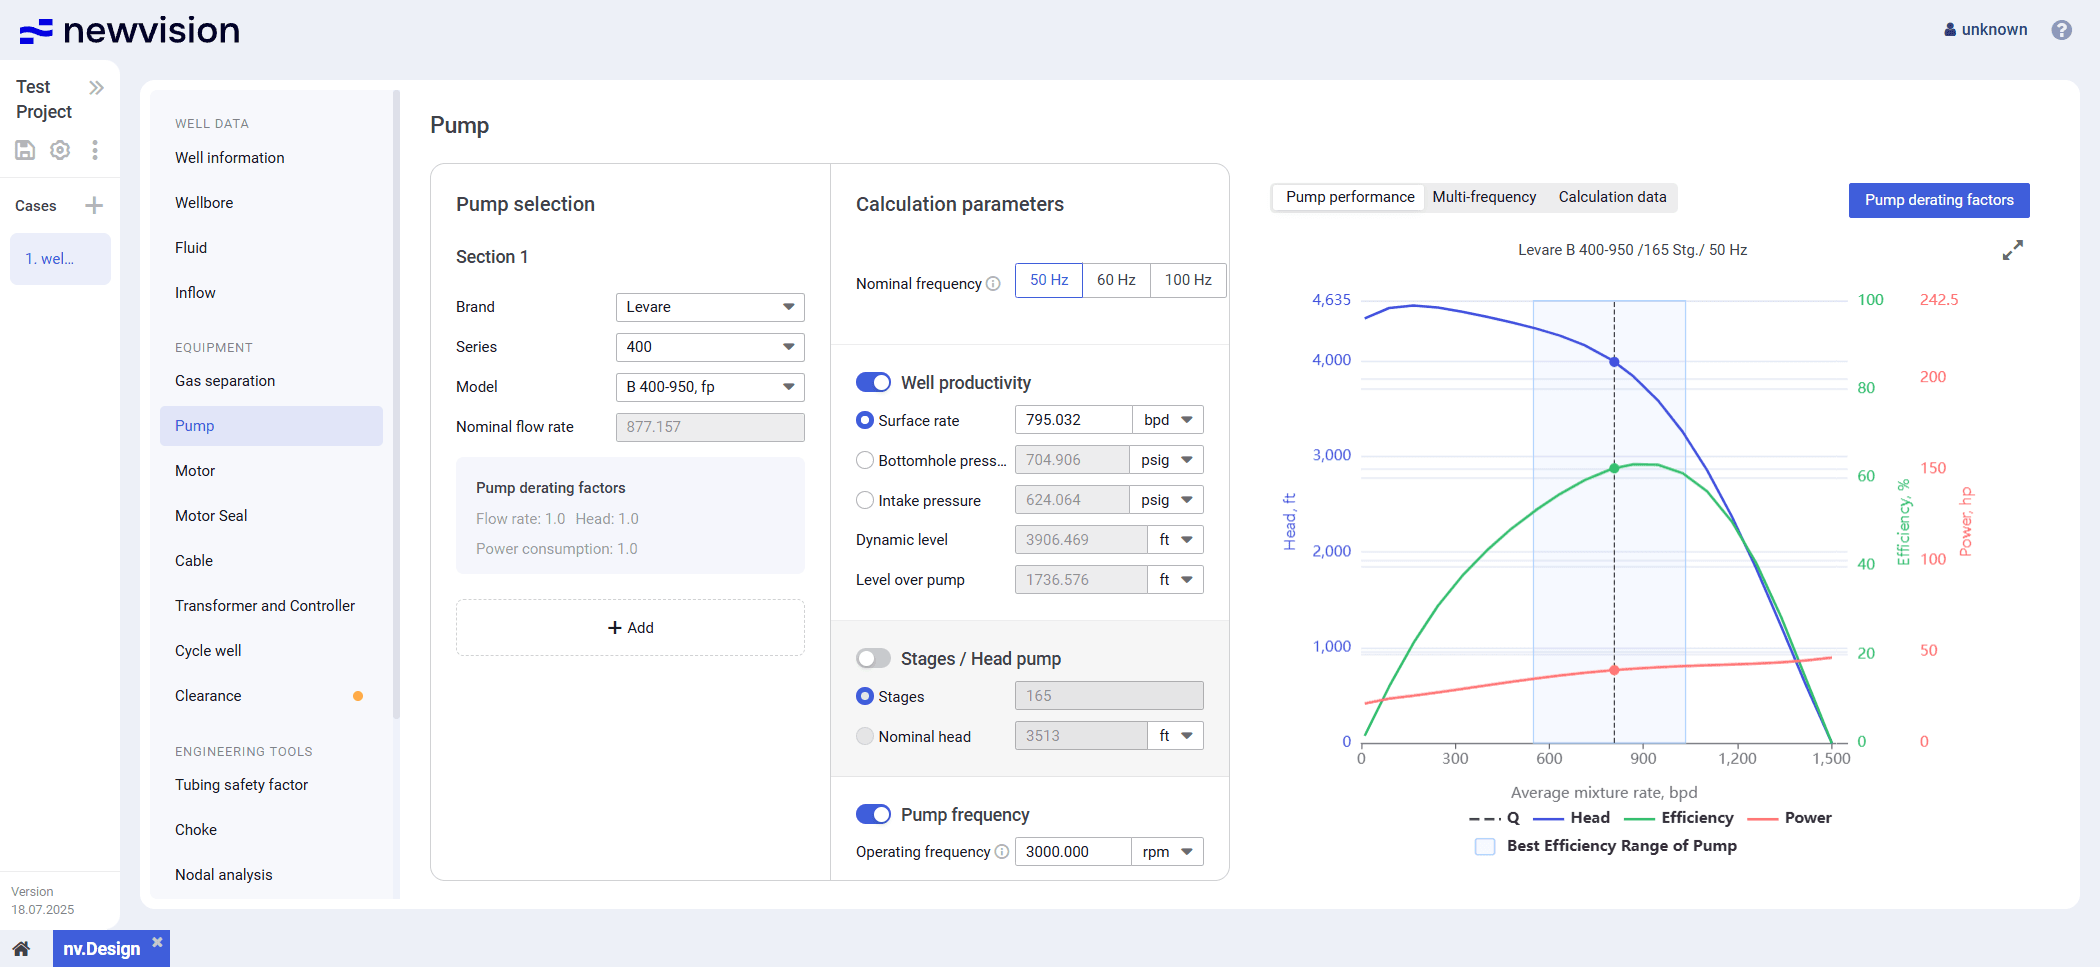
The Pump section provides information about the pump and target calculation parameters. This is the key section to which the equipment data must be added.
For details, see Configuring Pump Parameters.
The section consists of three panes:
- Pump selection pane in the left part of the section.
- Calculation parameters pane in the central part of the section.
- Visualization pane in the right part of the section.
Pump Selection
In this pane, you need to select a pump or several pump sections. To do this, click Add ( ), and then select the pump parameters from the corresponding lists.

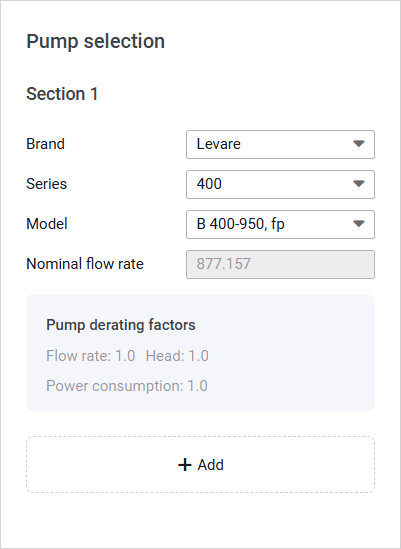
At the bottom of each pump section, the Pump derating factors area is displayed. The default derating factor value is 1, which means the section is operational and working normally. You can edit the derating factor values in the Derating factors window. For details, see Configuring Pump Parameters.
Calculation Parameters
In this pane, you can configure target parameters of the pump that are required for the calculation.
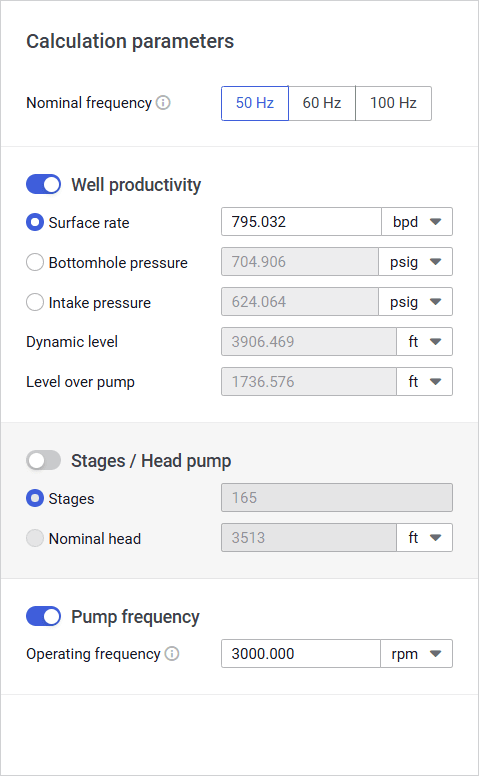
The pane contains three parameter groups:
- Well productivity
- Stages
- Pump frequency
You can select only two of these groups at the same time, the third will be calculated automatically. In case of conflicting inputs, other values are automatically recalculated.
| Important 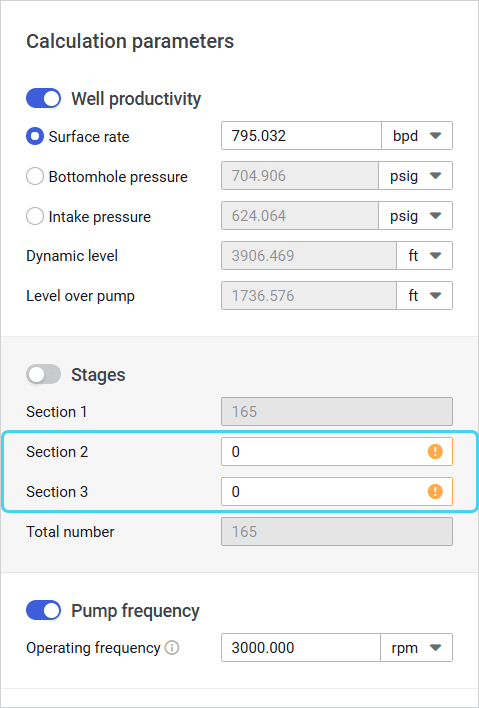 |
To select or deselect a parameter group, use the toggle to the left of the group name.
If only one pump section is selected in the Pump selection pane, at the top of the pane, the Nominal frequency parameter is displayed. Its value is used for calculating the pump’s nominal flow rate and nominal head.
By default, the 50 Hz option is selected.
Well productivity
In this group you can select one of the following target parameters and specify its value: Surface rate, Bottomhole pressure, or Intake pressure.
The Surface rate value is taken from the Inflow section. For details, see Inflow.
Stages
In this group, you can specify the number of stages of each pump section.
If there is only one section, instead of the number of stages, you can enter the nominal head value. The other parameter value is calculated automatically. If the number of stages is specified, the nominal head is calculated based on the catalog value obtained from the pump testing with water.
Pump Frequency
The group contains only one parameter, Operating frequency. By default, its value is set to 3600 rpm.
Visualization Pane
The pane contains charts that visualize pump operation characteristics.
Depending on the number of pump sections, the pane may consist of different tabs.
If there is only one pump section, the following tabs are available:
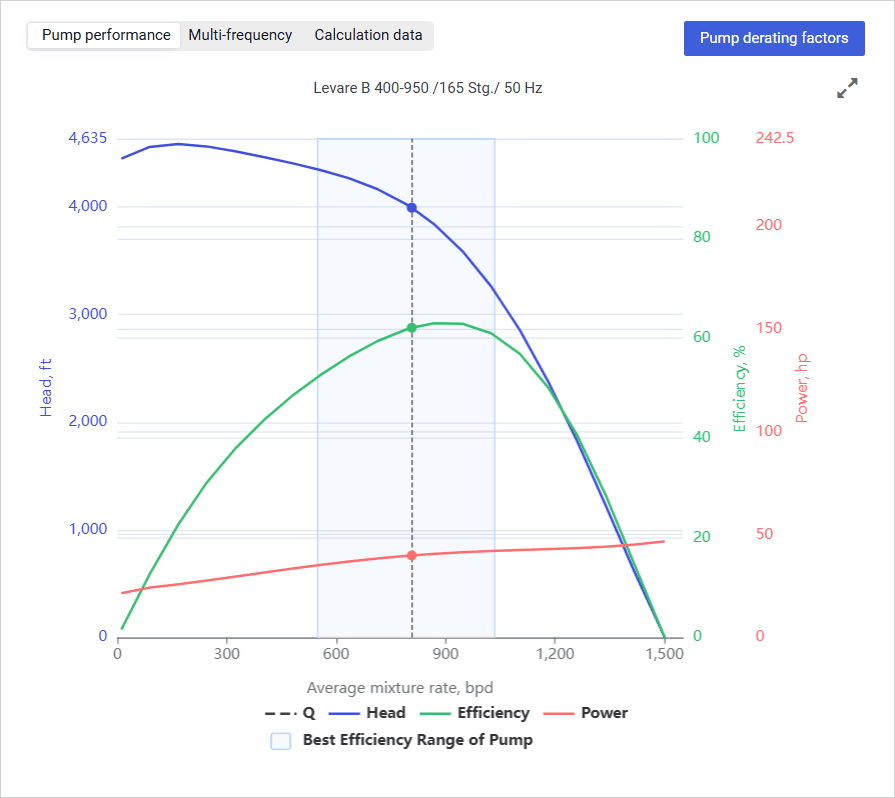
- Pump performance: Provides the pump H-Q (head-flow) curve with values of the pump flow rate, head, efficiency, power, and operating range.
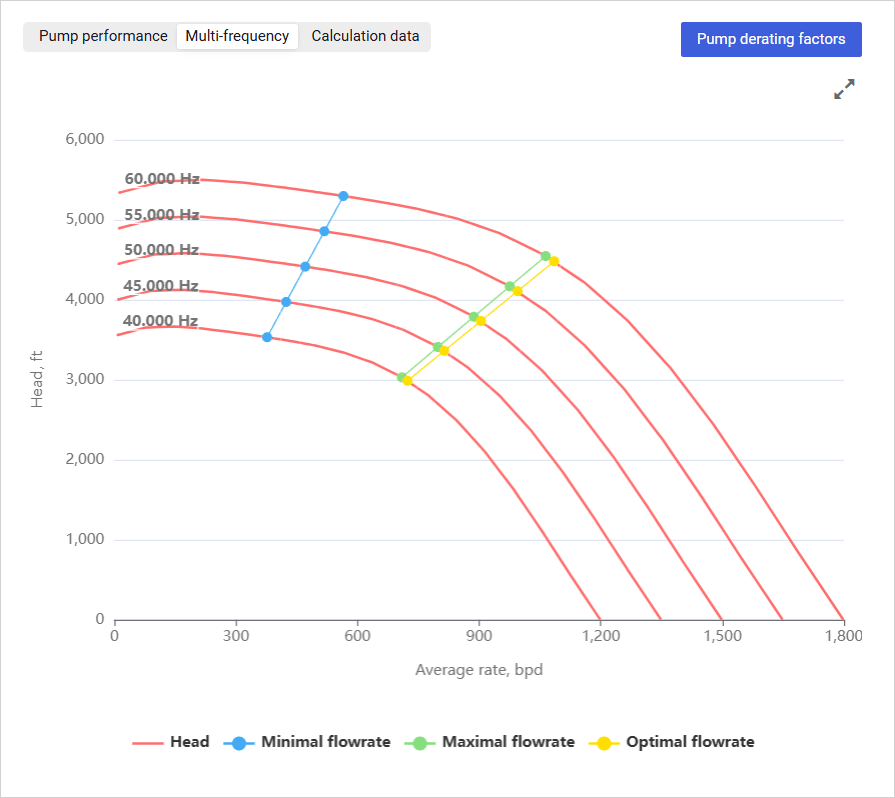
- Multi-frequency: Provides graphs of the pump head at various frequencies.
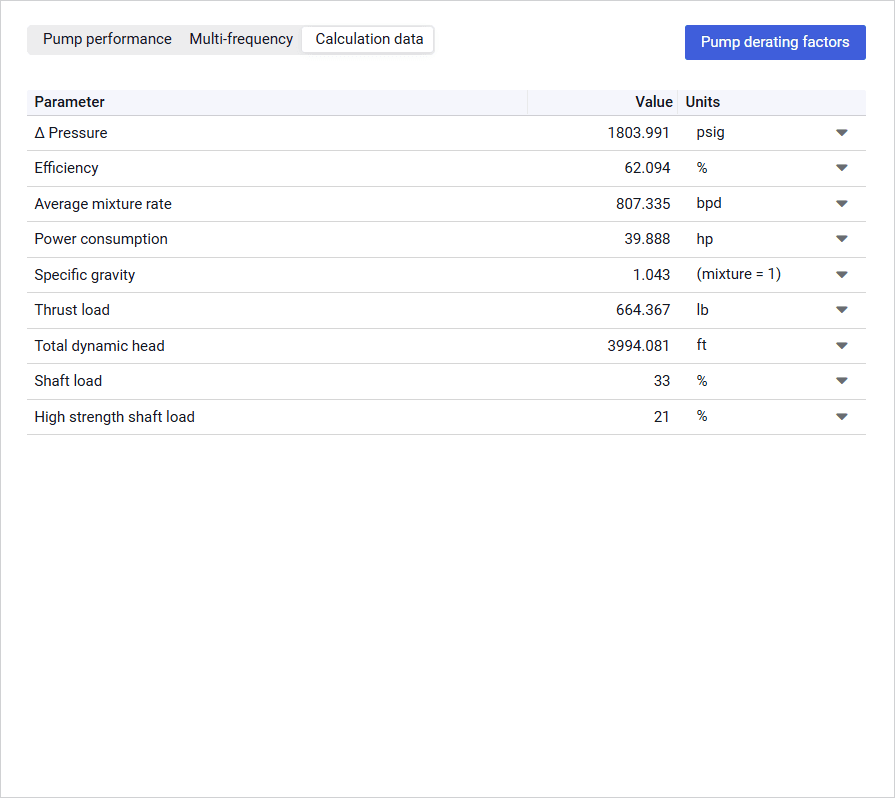
- Calculation data: Provides a table with values of the pump’s pressure differential, efficiency, power consumption, shaft load, etc. These parameters help to select the most suitable motor, motor seal, cable, and surface equipment.
For example, the Thrust load value can be used to select a motor seal so that the thrust bearing load remains within acceptable limits.
If there are two or three pump sections, the following tabs are available:
- Complete unit: Contains the same sub-tabs as a single-section pump (see description above) with integrated data for the whole pump configuration.
- Section 1: Provides the same data as the Pump performance tab (see description above) with the H-Q (head-flow) curve for the specific pump section.
- Section 2: Same as Section 1.
- Section 3: Same as Section 1.
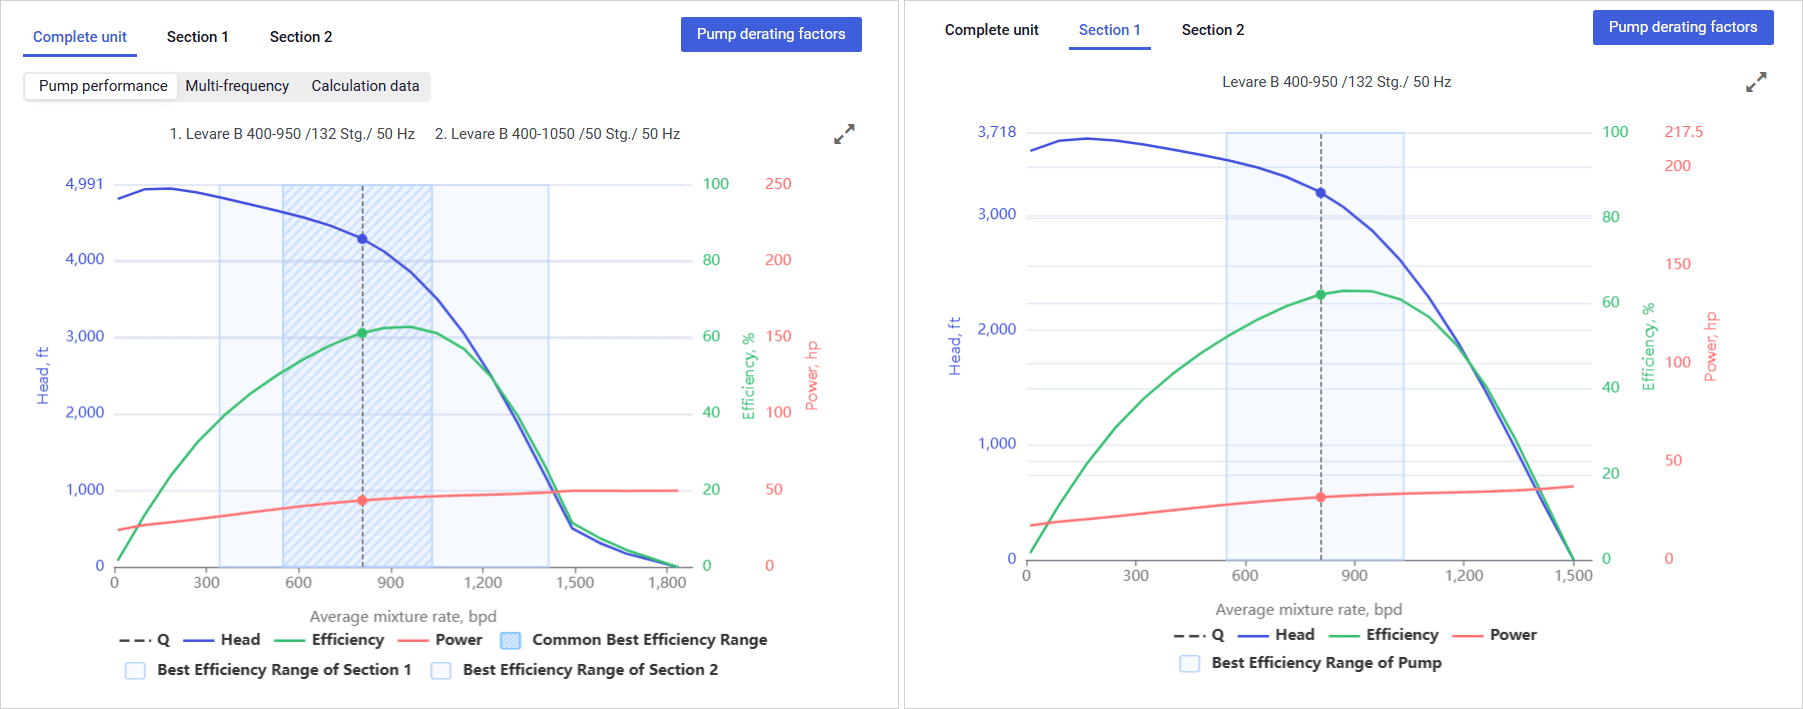
To show or hide a parameter on the chart, click the parameter name under it.
On hovering over any point on the chart, a window with information about the exact parameter values at this point is displayed.
You can also expand the pane to full screen or collapse it back to the original size using the Expand ( ) / Collapse ( ) buttons located in the upper-right corner of the pane.
Configuring Pump Parameters
To configure parameters of the pump installed in the well, perform the following actions:
- Open the nv.design module.
For details on navigation in the system, see System Interface. - In the left part of the working area, in the list of the module sections, click Pump.
To the right of the list, the Pump section opens.
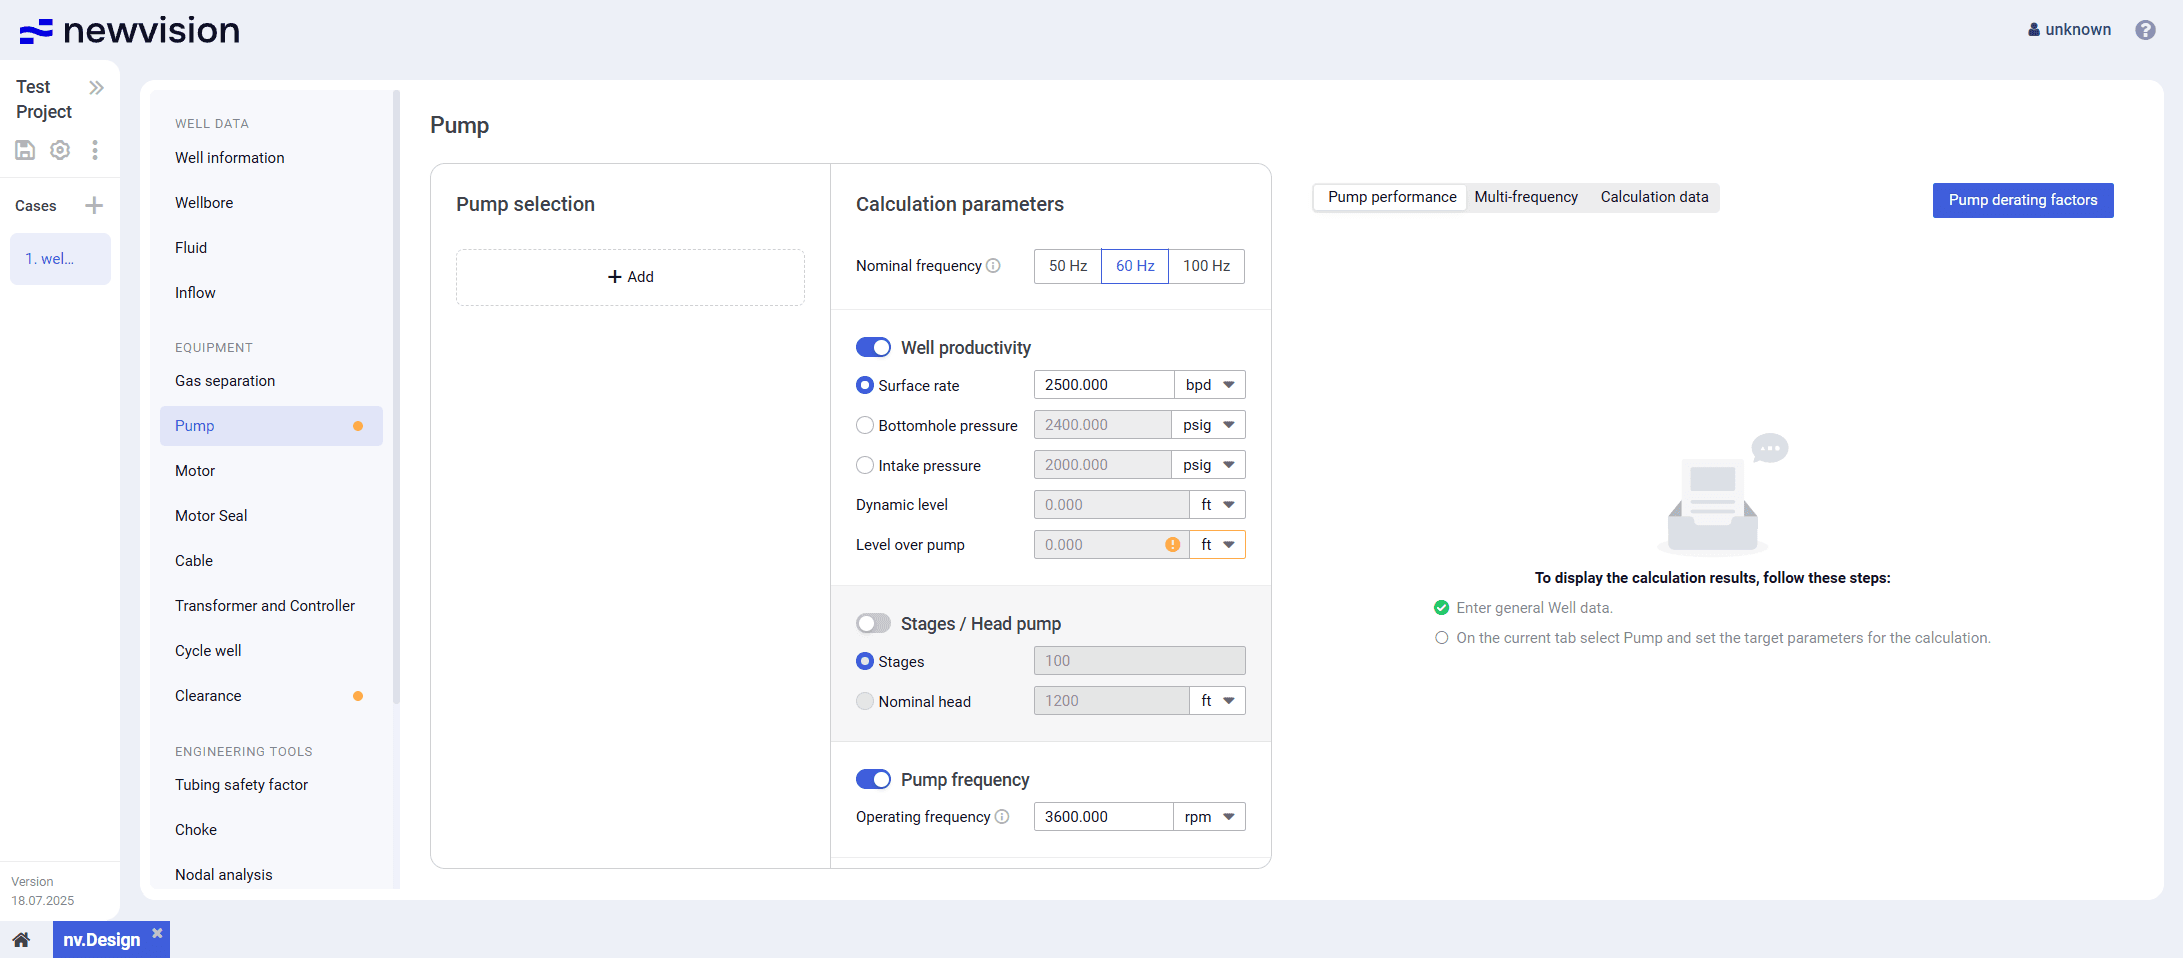
In the Pump selection pane, click Add ( ).
The Section 1 parameter group appears.
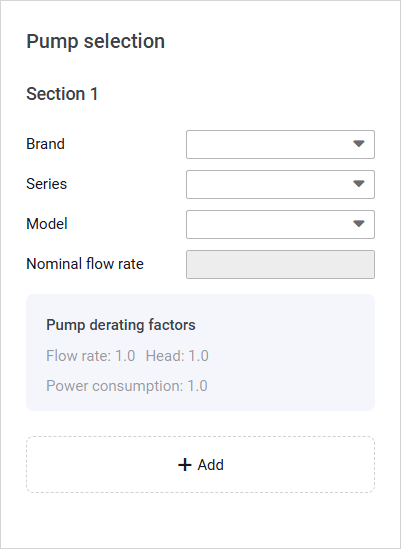
- Under the Section 1 heading, select a manufacture, series and model of the first pump section from the corresponding lists.
- (Optional) To add one or two more pump sections, repeat Steps 3–4.
- (Optional) To edit pump derating factors for the pump sections, perform the following actions:
- In the upper-right corner of the section, click Pump derating factors.
The Derating factors window opens.
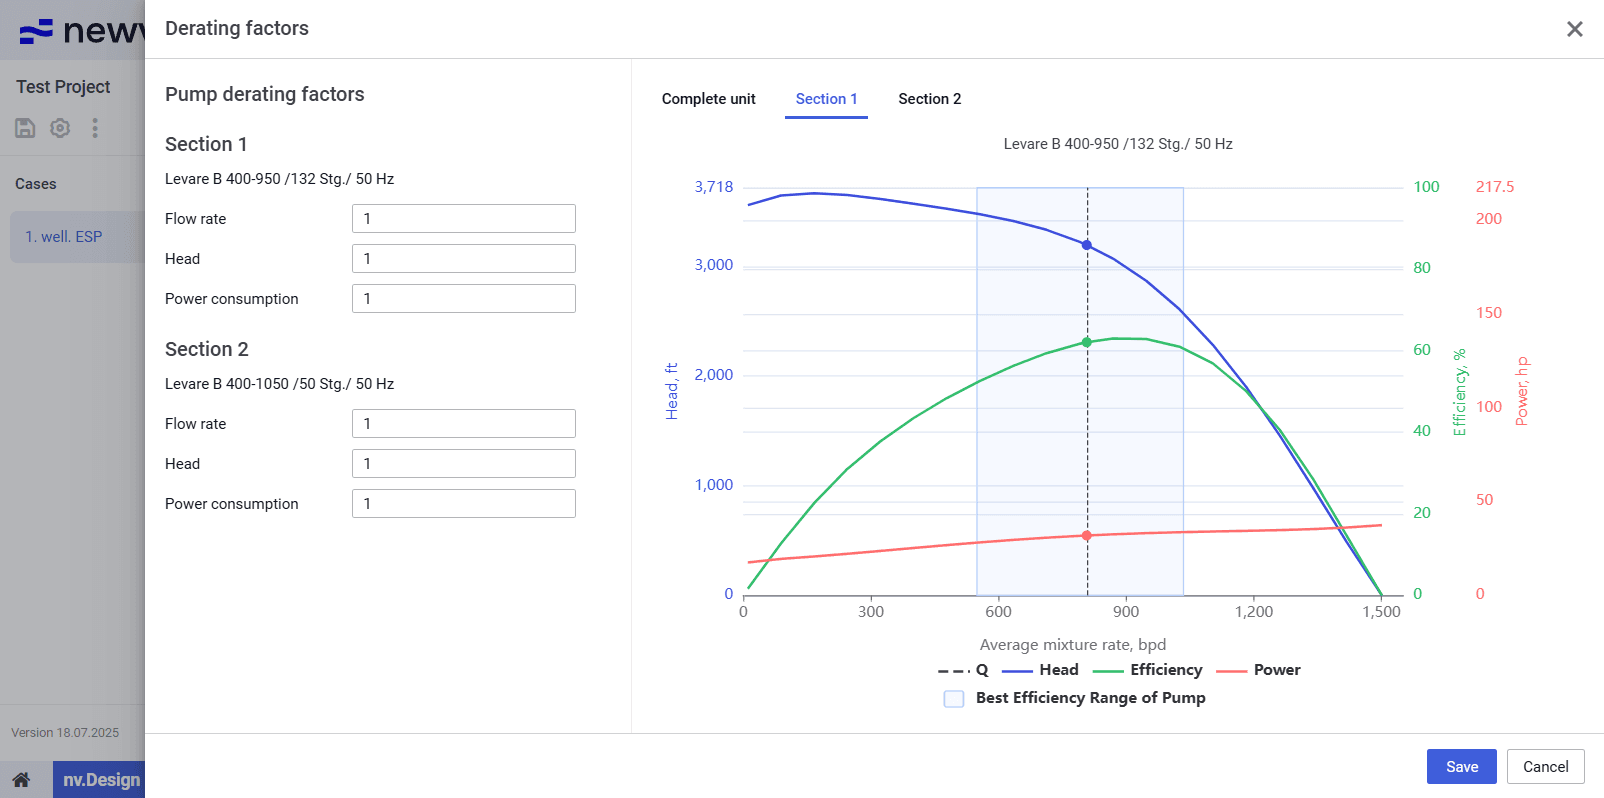
- In the window that opens, in the Flow rate, Head, and Power consumption fields, enter the derating factor values for the desired pump sections.
In the right part of the window, tabs with charts representing the pump operation characteristics are adjusted according to the entered derating factors. For details on these charts, see .
Warnings, if there are any, are displayed below the charts.
| Note |
- At the bottom of the window, click Save.
- In the Calculation parameters pane, enable two of the three parameter groups based on which further calculations will be performed. To do this, use the toggle to the left of the group name.
- Depending on the selected groups, perform the following actions:
- (For Well productivity) Select the target parameter (Surface rate, Bottomhole pressure, or Intake pressure) and specify its value.
The other group parameters are calculated automatically. - (For Stages) Depending on the number of the pump sections, perform one of the following actions:
- If there is only one section, select the parameter based on which the calculation will be performed (Stages or Nominal head) and specify it value.
The other parameter is calculated automatically. - If there are two or three sections, specify the number of stages for the second and the third sections.
- (For Pump frequency) Specify the pump operating frequency.
The default value is 3 600 rpm.
| Note |
- After the configuration is completed, in the right part of the section, charts representing the pump performance are displayed. For details on the charts that are displayed in the visualization pane, see .
To save changes, in the left part of the module, click Save ( ) under the name of the current project.

Motor
The Motor section provides information about the pump motor installed in the well.
| Note |
The section consists of the following parts:
- Equipment pane in the left part of the section.
- Operation data and Heat data tables in the central part of the section.
- Visualization pane in the right part of the section.
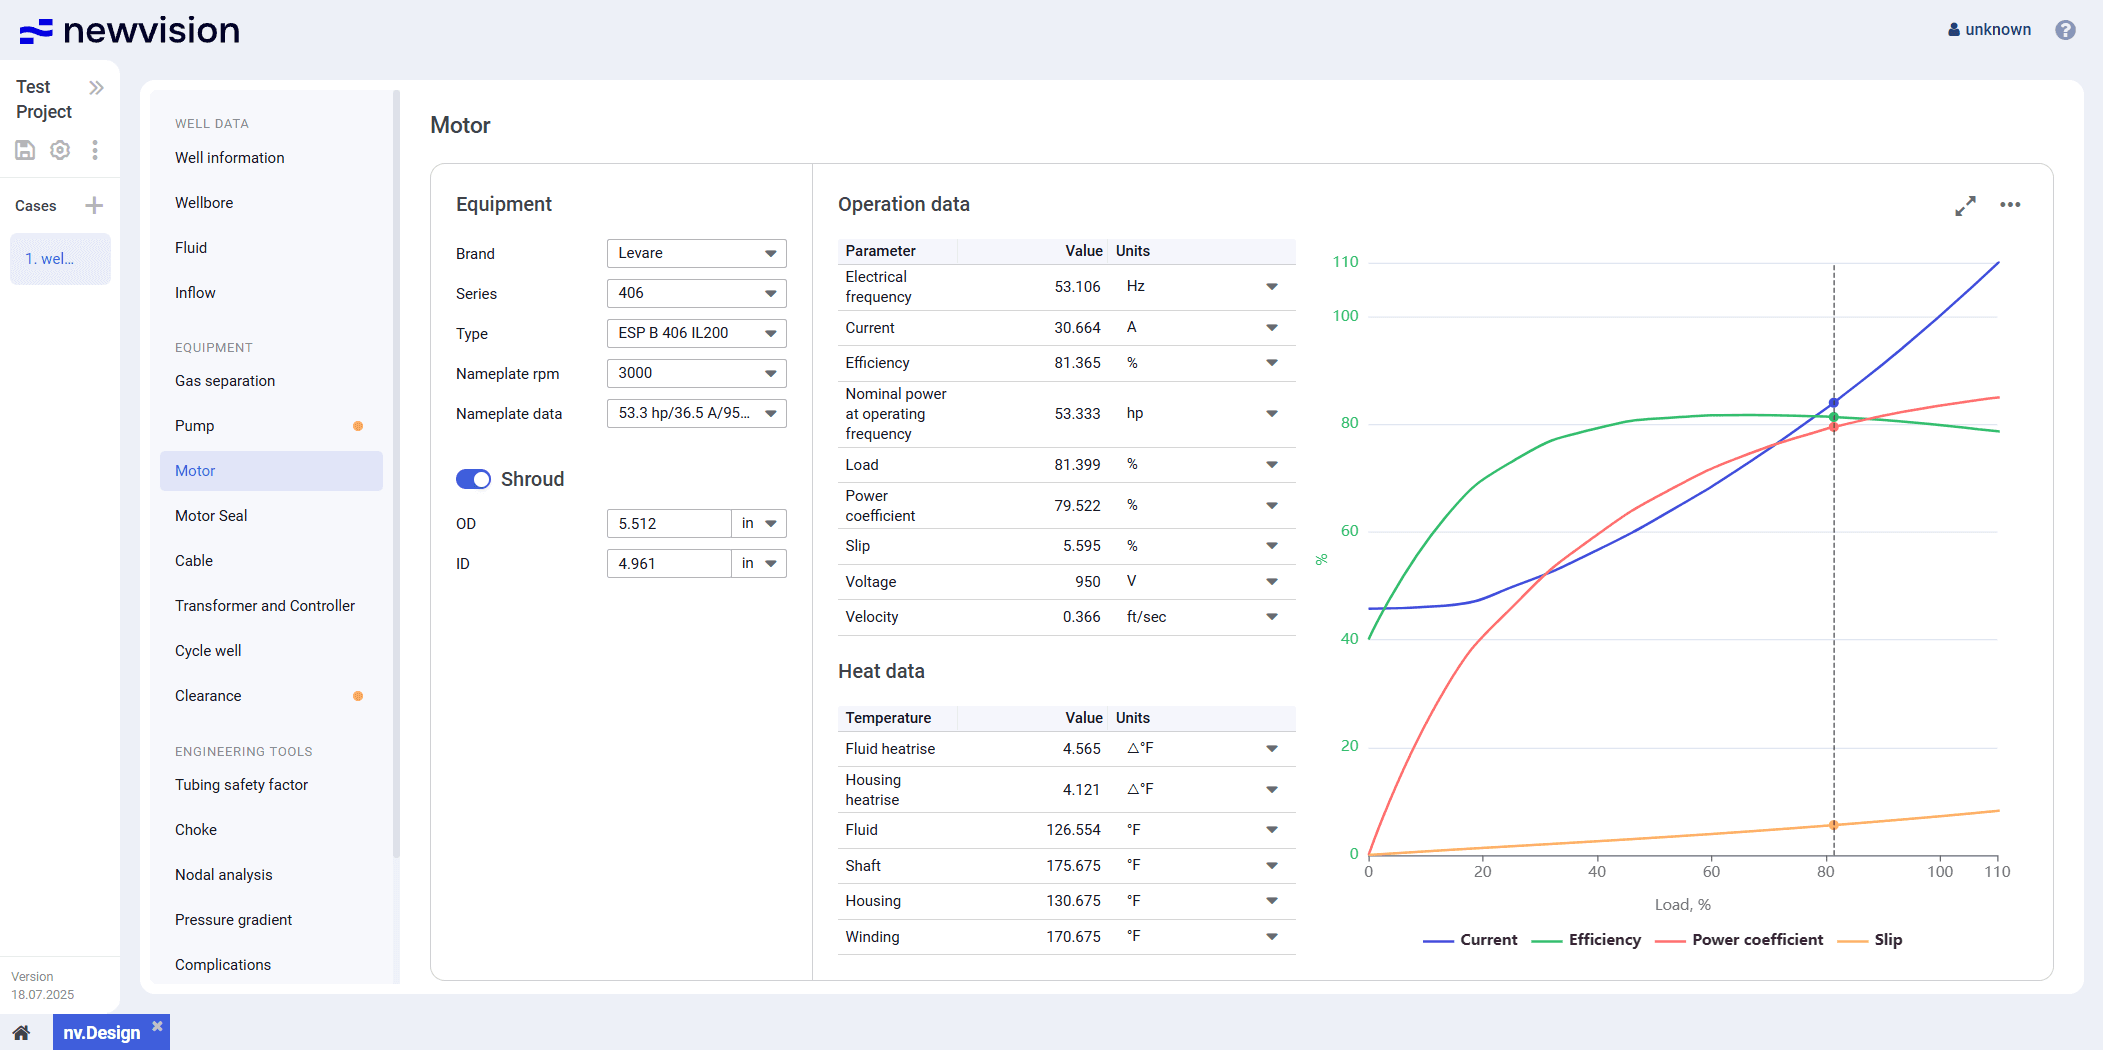
Equipment
The pane provides controls for the motor selection.
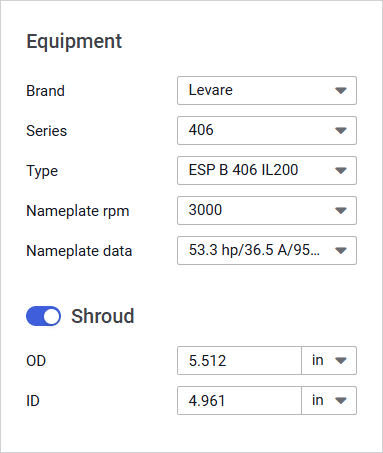
To select a motor, select the desired options from the parameter lists.
| Note |
If a shroud is used, enable the Shroud parameter group using the corresponding toggle.
| Note |
In the Shroud group, you can edit default values of the shroud outer (OD) and inner (ID) diameters.
If the shroud is not used, the fluid velocity is calculated in the annular space between the casing and the motor housing.
Operation Data and Heat Data
The Operation data and Heat data tables provide calculation results for the selected motor configuration.
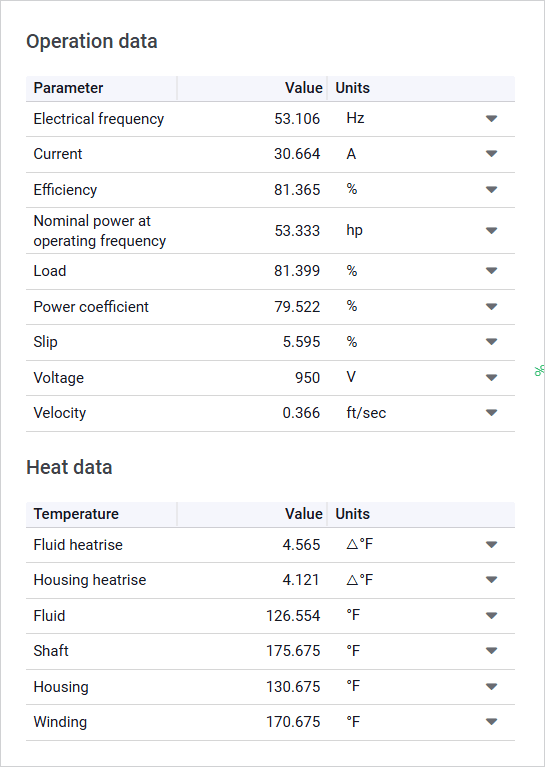
The Electrical frequency parameter corresponds to the rate at which the alternating current changes direction. It determines the rotational speed of the magnetic field in the motor stator and directly affects the shaft’s rotational speed. This value is calculated based on the number of motor poles and the actual rotor speed. In induction motors, the rotor always spins slightly slower than the magnetic field—a phenomenon called slip (the Slip parameter in the table)—which is essential for generating torque.
| Note |
The Velocity parameter and parameters from the Heat data table can be used to select a motor with suitable dimensional specifications and maximum winding temperature.
Visualization Pane
The pane contains a chart that represents the motor performance parameters under varying motor loads (X-axis) along with their percentages compared to nominal values (Y axis).
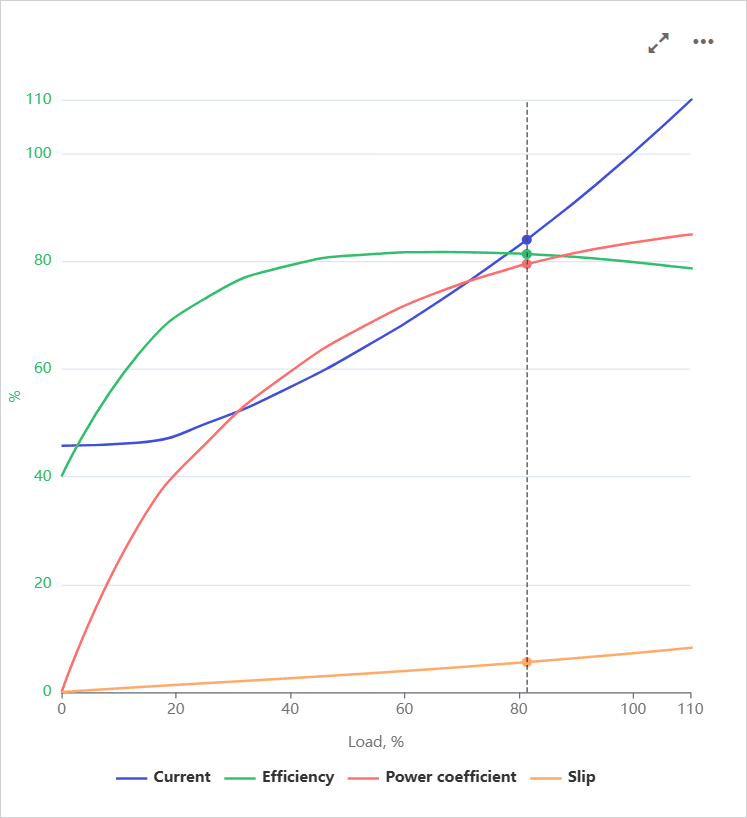
On hovering over the chart, a vertical dashed line is displayed. The intersection points of the line with the parameter curves represent the motor operating points. On hovering over these points, a window with information about the exact parameter values at this point is displayed.
To show or hide a parameter on the chart, click the parameter name under it.
You can also expand the pane to full screen or collapse it back to the original size using the Expand ( ) / Collapse ( ) buttons located in the upper-right corner of the pane.
Motor Seal
The Motor Seal section provides information about the seal installed at the motor.
The section consists of the following parts:
- Equipment pane in the left part of the section.
- Operation data table in the central part of the section.
- Visualization pane in the right part of the section.
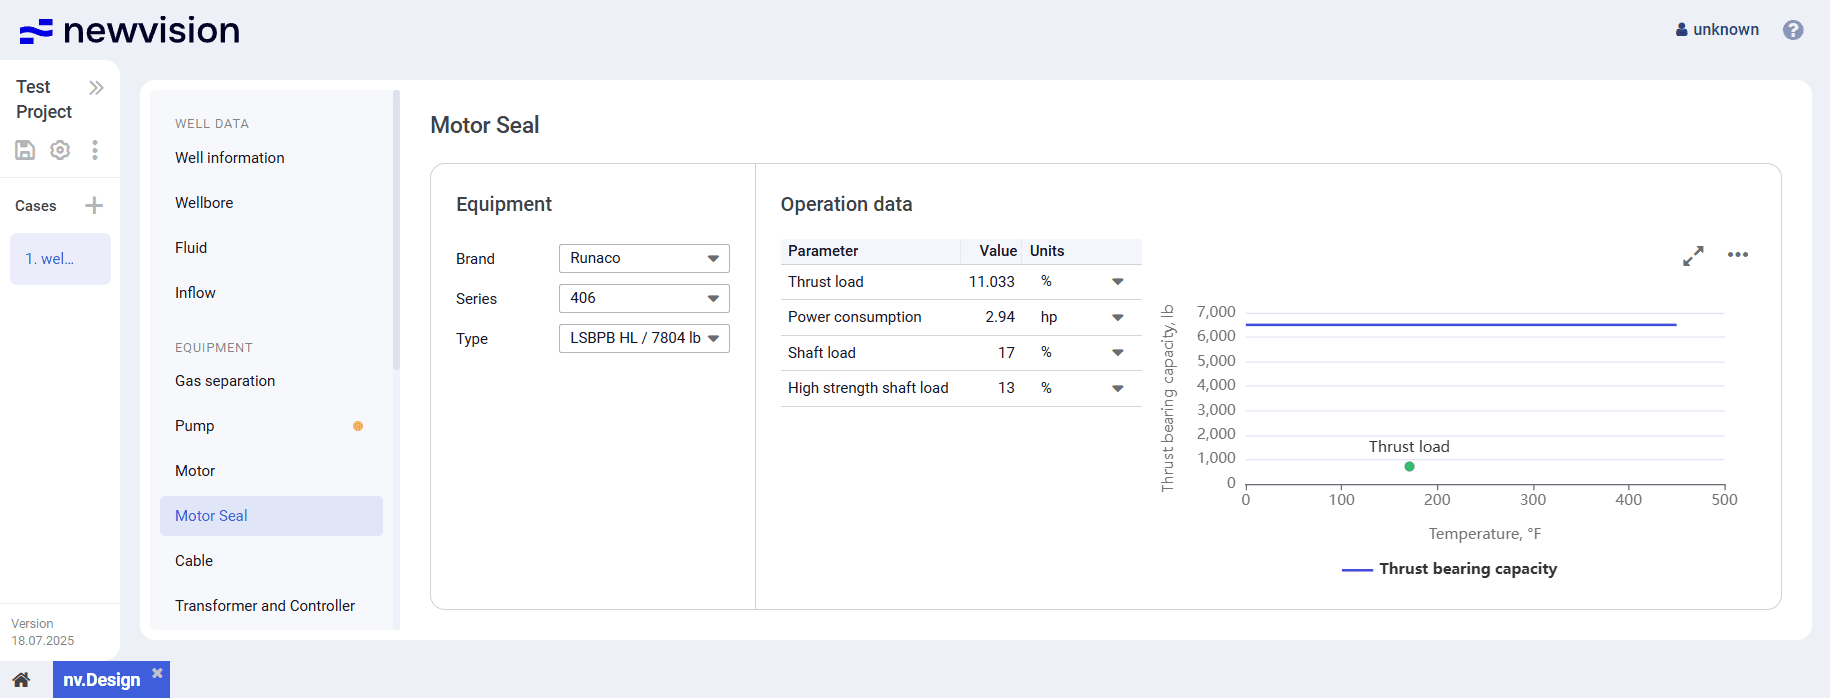
Equipment
The pane provides controls for the motor seal selection.
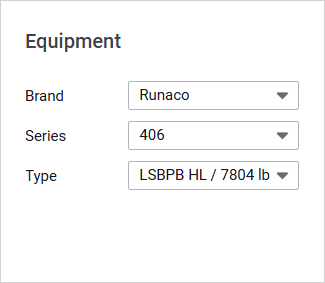
To select a seal, select the desired options from the parameter lists.
Operation Data
The Operation data table provides calculation results for the selected motor seal. The motor seal capacity and load are calculated based on the thrust load value from the Calculation data table in the section.
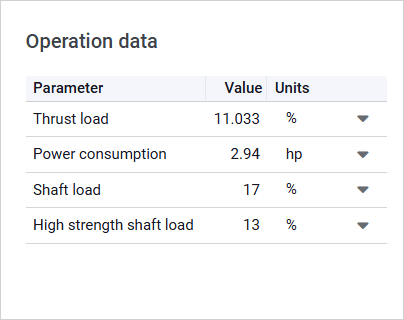
The table contains values of the following parameters expressed in percentages relative to their nominal values:
- Thrust load: Actual thrust load relative to the nominal thrust bearing capacity.
- Power consumption: Estimated energy consumption of the motor seal.
- Shaft load: Load on the shaft relative to the maximum allowable load for a standard-strength shaft.
- High strength shaft load: Load on the shaft relative to the maximum allowable load for a high-strength shaft.
If any of the calculated load values exceed acceptable thresholds, the system shows a warning that recommends selection of a motor seal with a higher thrust capacity.
Visualization Pane
The pane contains a motor seal performance chart displaying the Thrust bearing capacity parameter values at different operating temperatures.
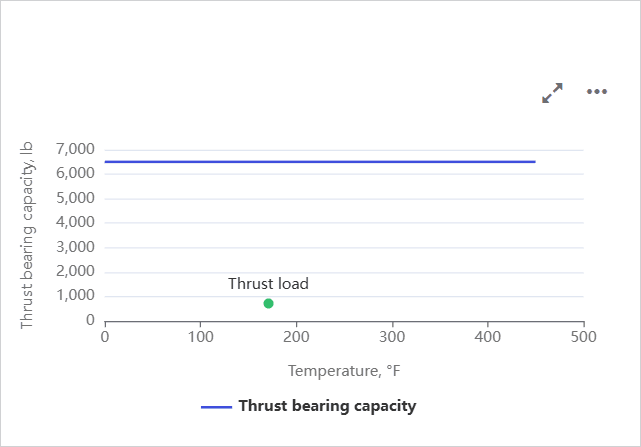
The green dot represents the current operating point. On hovering over it, a window with information about the thrust load and corresponding temperature is displayed.
You can also expand the pane to full screen or collapse it back to the original size using the Expand ( ) / Collapse ( ) buttons located in the upper-right corner of the pane.
Cable
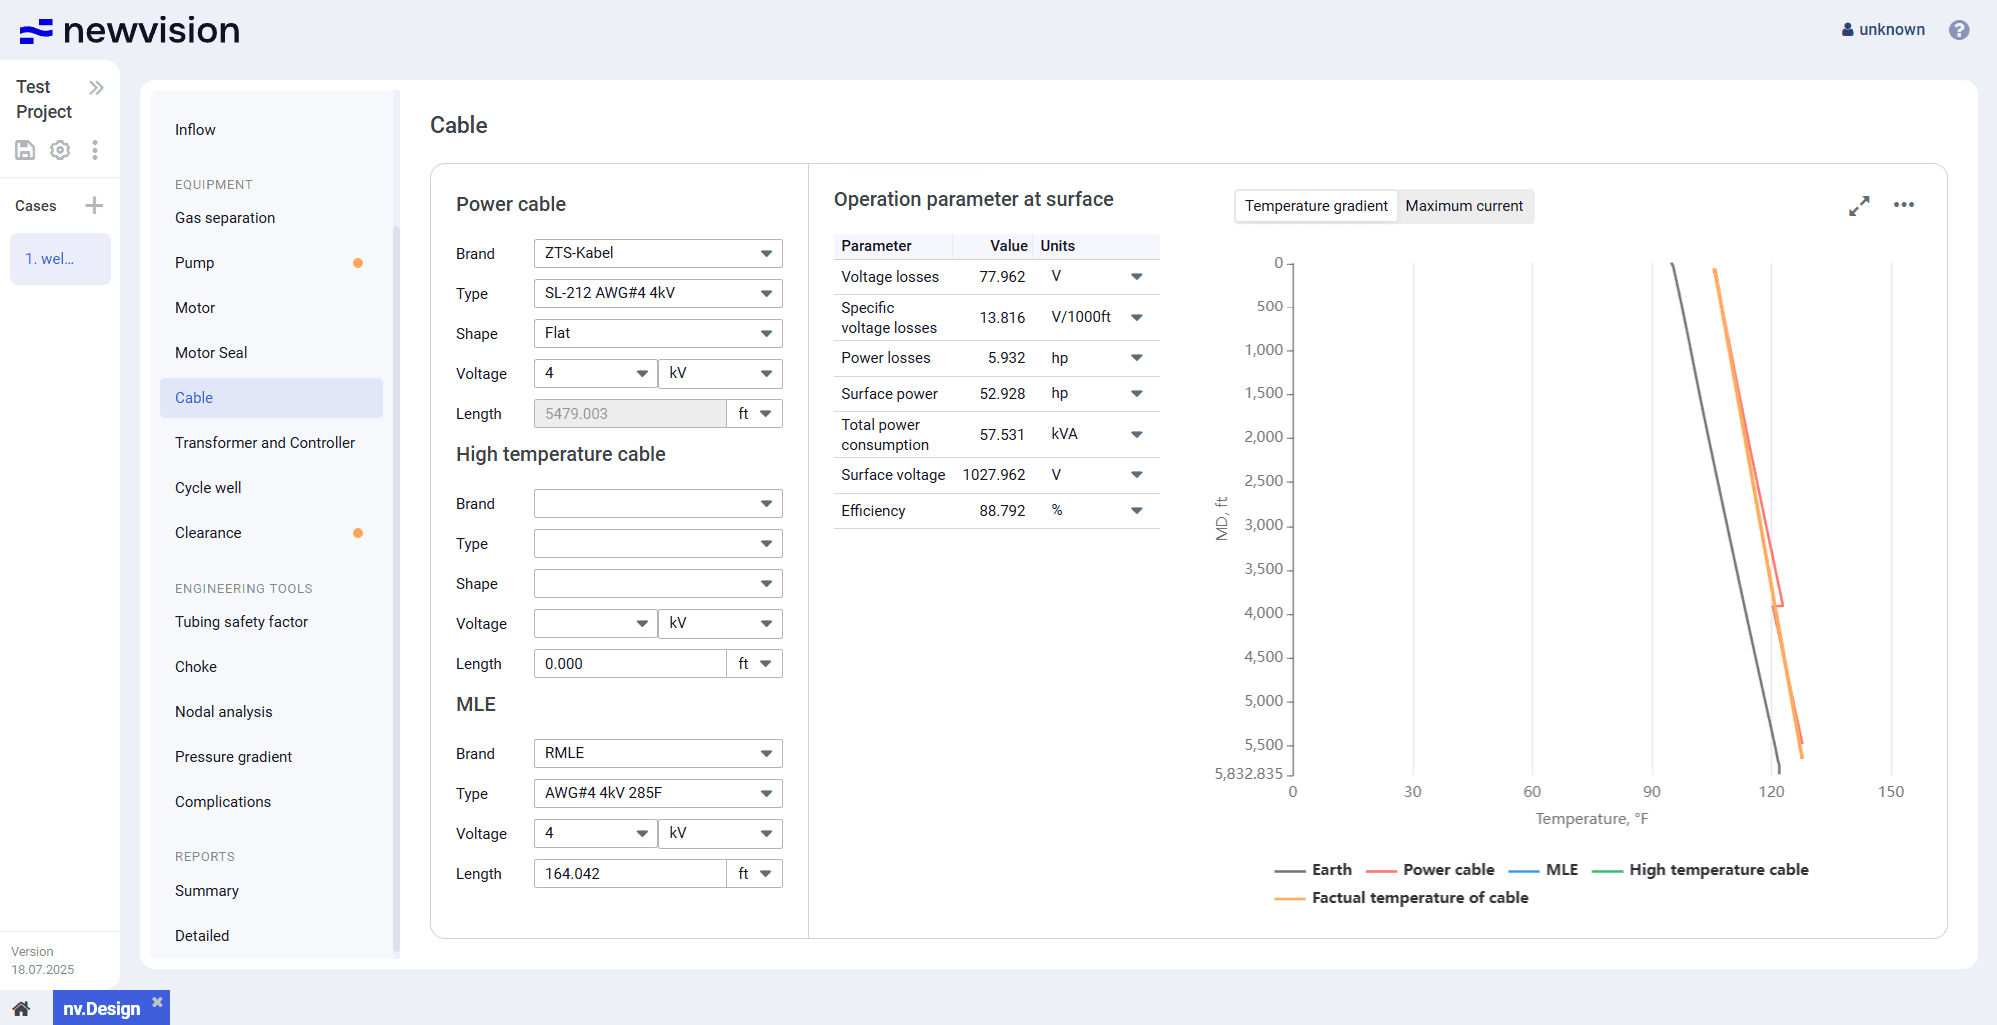
The Cable section provides information about the cable. You can configure up to three cable segments.
The section consists of the following parts:
- Power cable, High temperature cable, and MLE parameter groups in the left part of the section.
- Operation parameter at surface table in the central part of the section.
- Visualization pane in the right part of the section.
Power Cable, High Temperature Cable, and MLE
These parameter groups provide controls for selection and configuration of the cable segments.
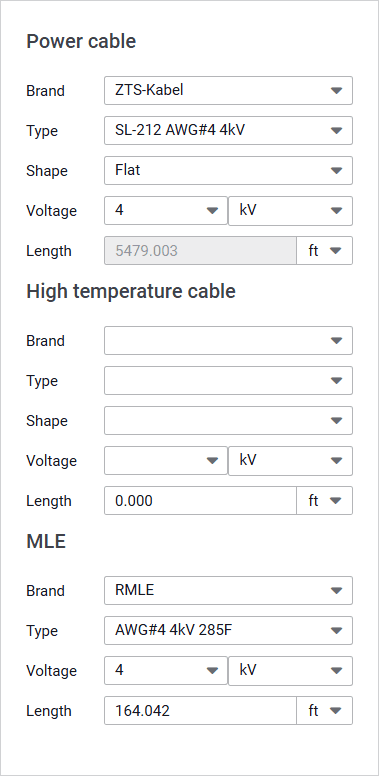
Power cable
This is the main parameter group. Power cable is typically laid from the surface to the ESP setting depth. Its length is calculated automatically and equals the installation depth specified in the Wellbore section. For details, see Wellbore configuration.
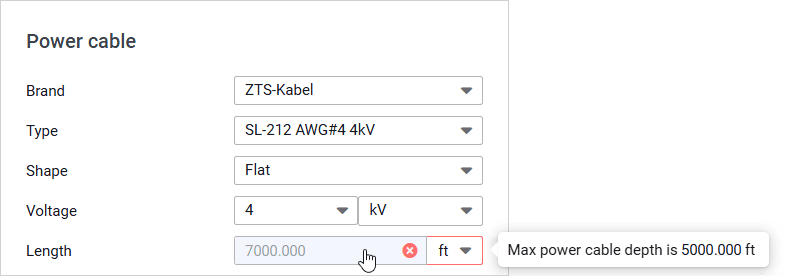
The system also provides a warning mechanism that evaluates the maximum allowable cable power cable length based on the temperature down the wellbore. If the wellbore temperature exceeds the power cable's maximum nominal value, the error icon ( ) is displayed. In this case, a high-temperature cable must be used.
For example, if the ESP setting depth is 7 000 ft and the tooltip says ‘Max power cable depth is 5 000 ft’, that means that a high-temperature cable and/or motor lead extension (see description below) must be used for 2 000 ft.

High temperature cable
High temperature cables are recommended for high-temperature zones (e.g., due to hot fluid, high reservoir temperature, or significant operating currents) where considerable heat generation may occur.
Such cables are designed for enhanced thermal resistance and should be routed from the ESP setting depth to the depth at which the temperature becomes acceptable for a standard power cable.
MLE (Motor Lead Extension)
Extensions are used in the pump setting zone to connect the cable to the motor with a transition to a different thermal rating.
| Note |
Operation Parameter at Surface
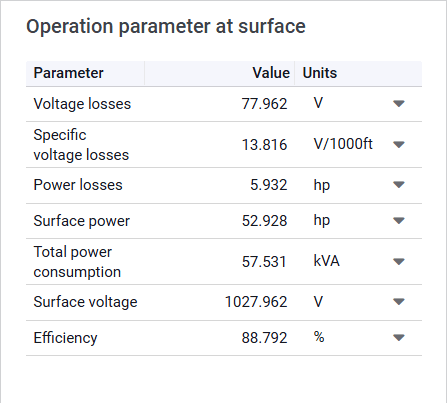
The Operation parameter at surface table provides calculation results for the selected cable configuration.
Visualization Pane
The pane consists of two charts distributed on different tabs:
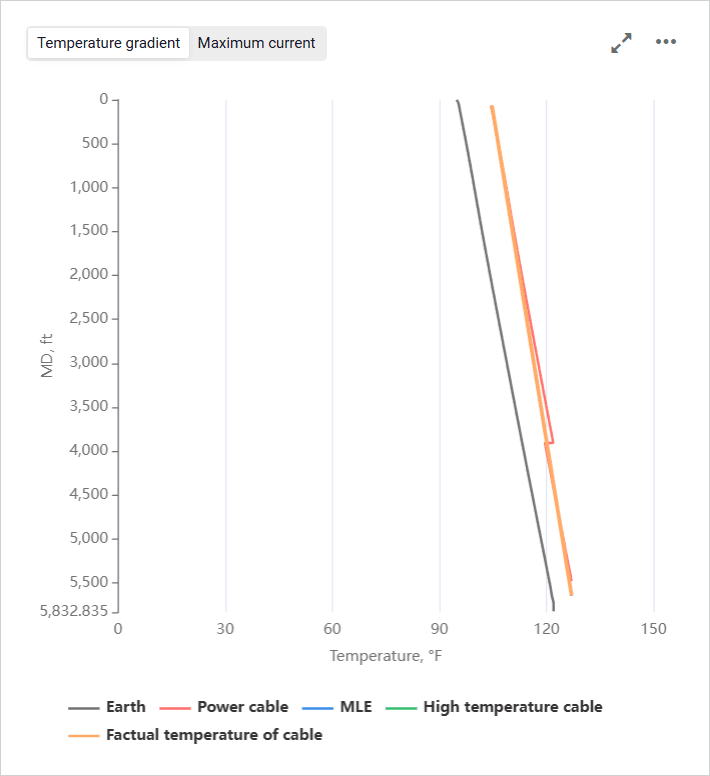
- Temperature gradient: Chart representing submersible electric cable.
The Power cable, MLE, and High temperature cable curves account for the following physical phenomena: temperature jumps when transitioning from gas to liquid, splices, insulation and armor losses, annulus thermal gradient considering inclination, etc.
The Factual temperature of cable curve reflects the dynamic longitudinal redistribution of temperature over time along the entire cable length.
- Maximum current: Chart representing dependence of the allowable current on the maximum temperature of the well fluid.
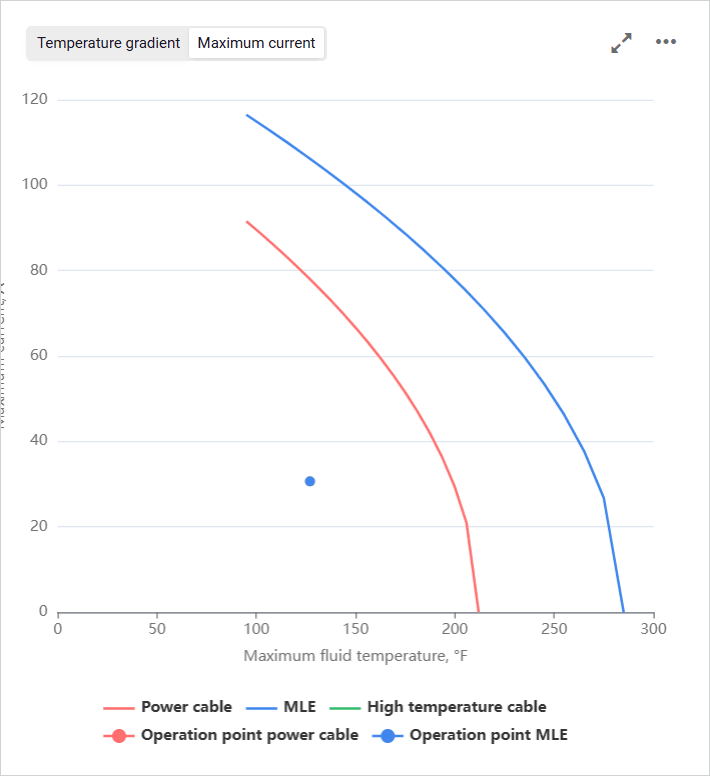
To show or hide a parameter on the chart, click the parameter name under it.
On hovering over any point on the chart, a window with information about the exact parameter values at this point is displayed.
You can also expand the pane to full screen or collapse it back to the original size using the Expand ( ) / Collapse ( ) buttons located in the upper-right corner of the pane.
Transformer and Controller
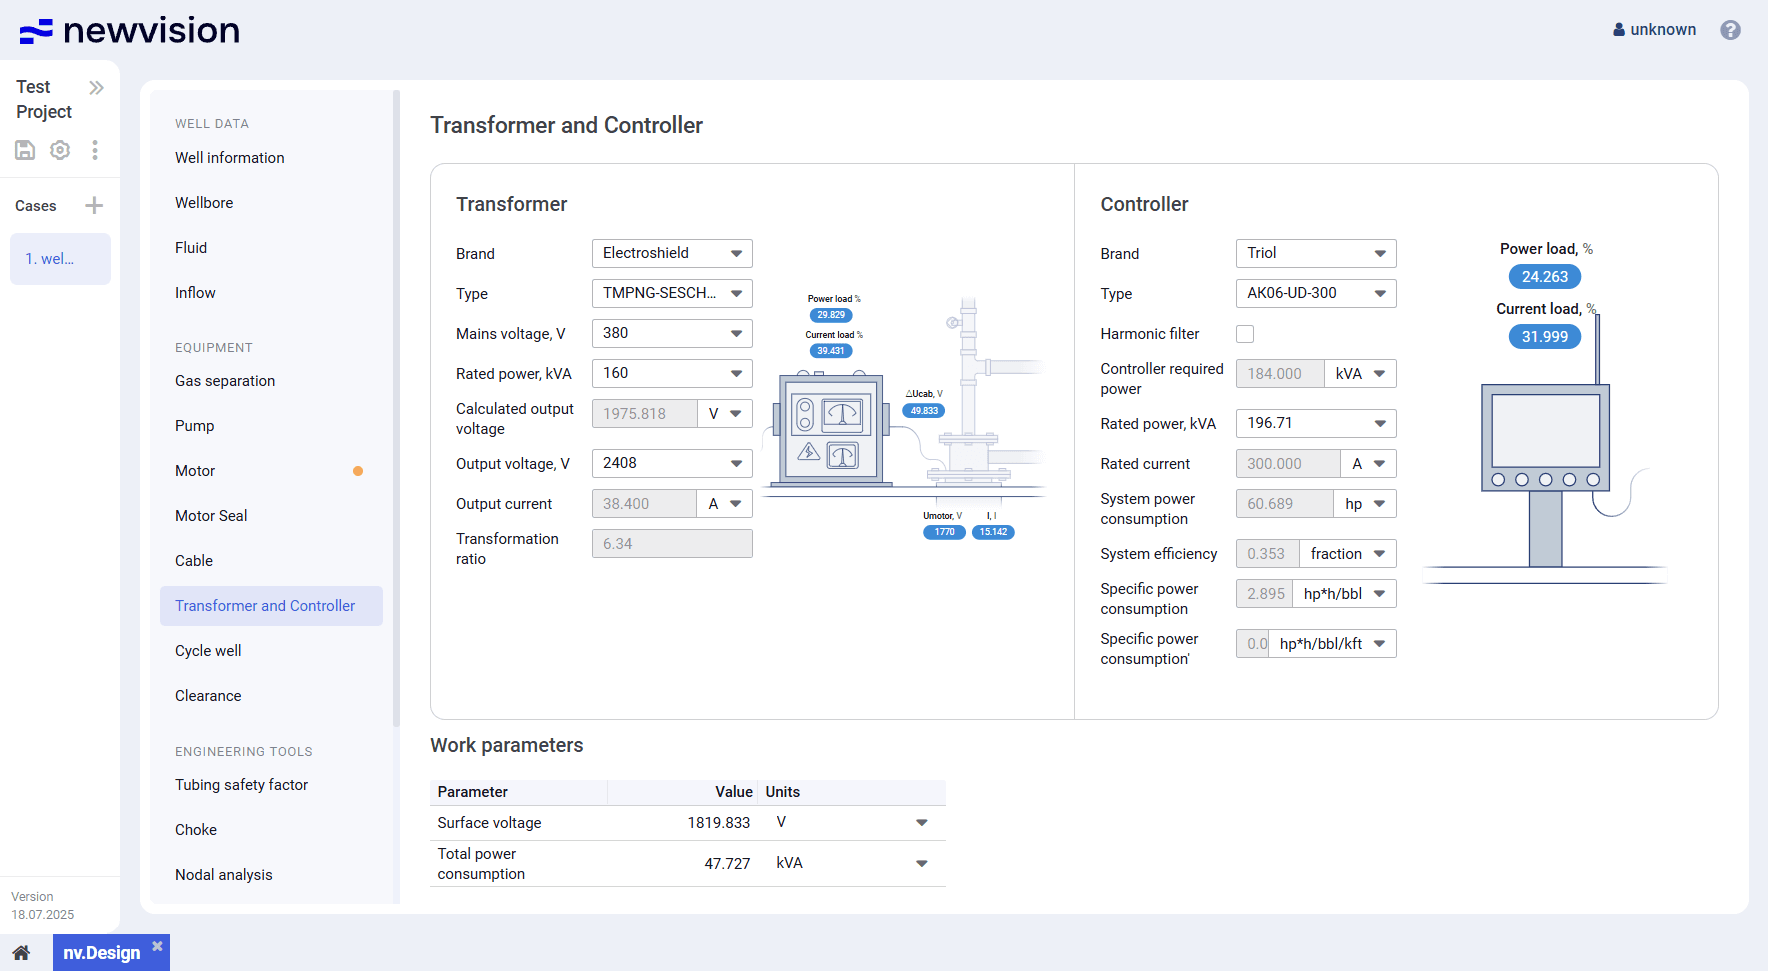
This section provides information about the surface equipment layout, specifically controller and transformer.
The section consists of the following panes:
- Transformer
- Controller
- Work parameters
Transformer
The pane provides controls for the transformer selection and configuration.
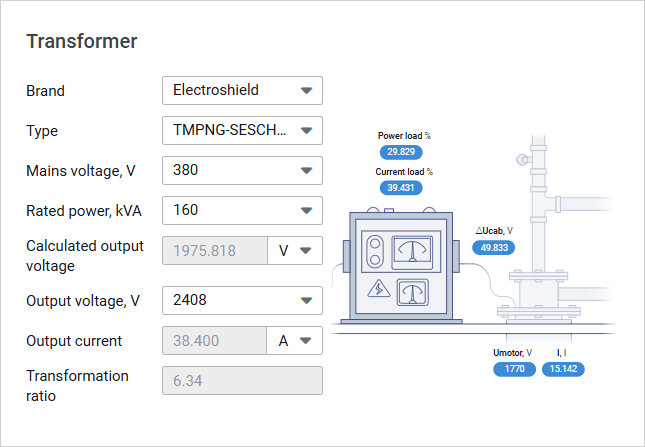
To select a transformer, select the desired options from the corresponding parameter lists.
The Calculated output voltage parameter refers to the voltage considering losses across all elements in the system. It is calculated based on other input parameters in the group.
The Output voltage value corresponds to the selected tap voltage. It is selected from the list and must be as close as possible but slightly greater than the Calculated output voltage value.
The Transformation ratio parameter reflects the relationship between the input and output voltages of the transformer. The value is calculated automatically.
In the left part of the pane, a simplified visualization of the selected transformer configuration is displayed. Labels with values of the key parameters provide the ability to assess efficiency of the equipment.
Controller
The pane provides controls for the controller selection and configuration.
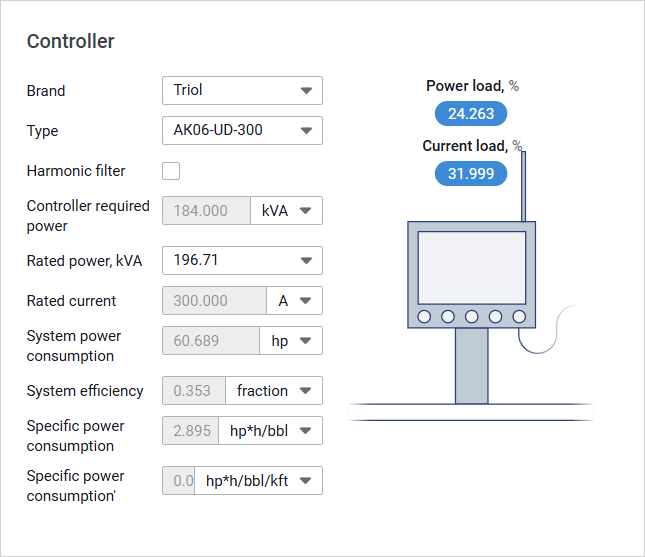
To select a controller, select the desired options from the corresponding parameter lists.
The control unit must be capable of handling both operating and starting voltage and current.
In the left part of the pane, a simplified visualization of the selected controller configuration is displayed. Labels with values of the key parameters provide the ability to assess efficiency of the equipment.
Work Parameters
The pane provides a table with values of the following operating parameters:
- Surface voltage: Based on this value, you can select the required transformer tap.
- Total power consumption: Based on this value, you can select a transformer with an appropriate nominal power.
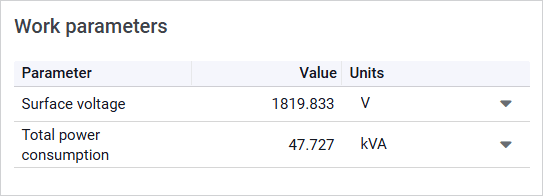
Both values are taken from the Operation parameter at surface table in the section.
Clearance
The Clearance section provides information about the equipment dimensions and the minimum required clearance. This data is required to ensure that all downhole equipment can be safely run into the wellbore.
The section consists of the following parts:
- Equipment pane in the left part of the section.
- Visualization pane in the right part of the section.
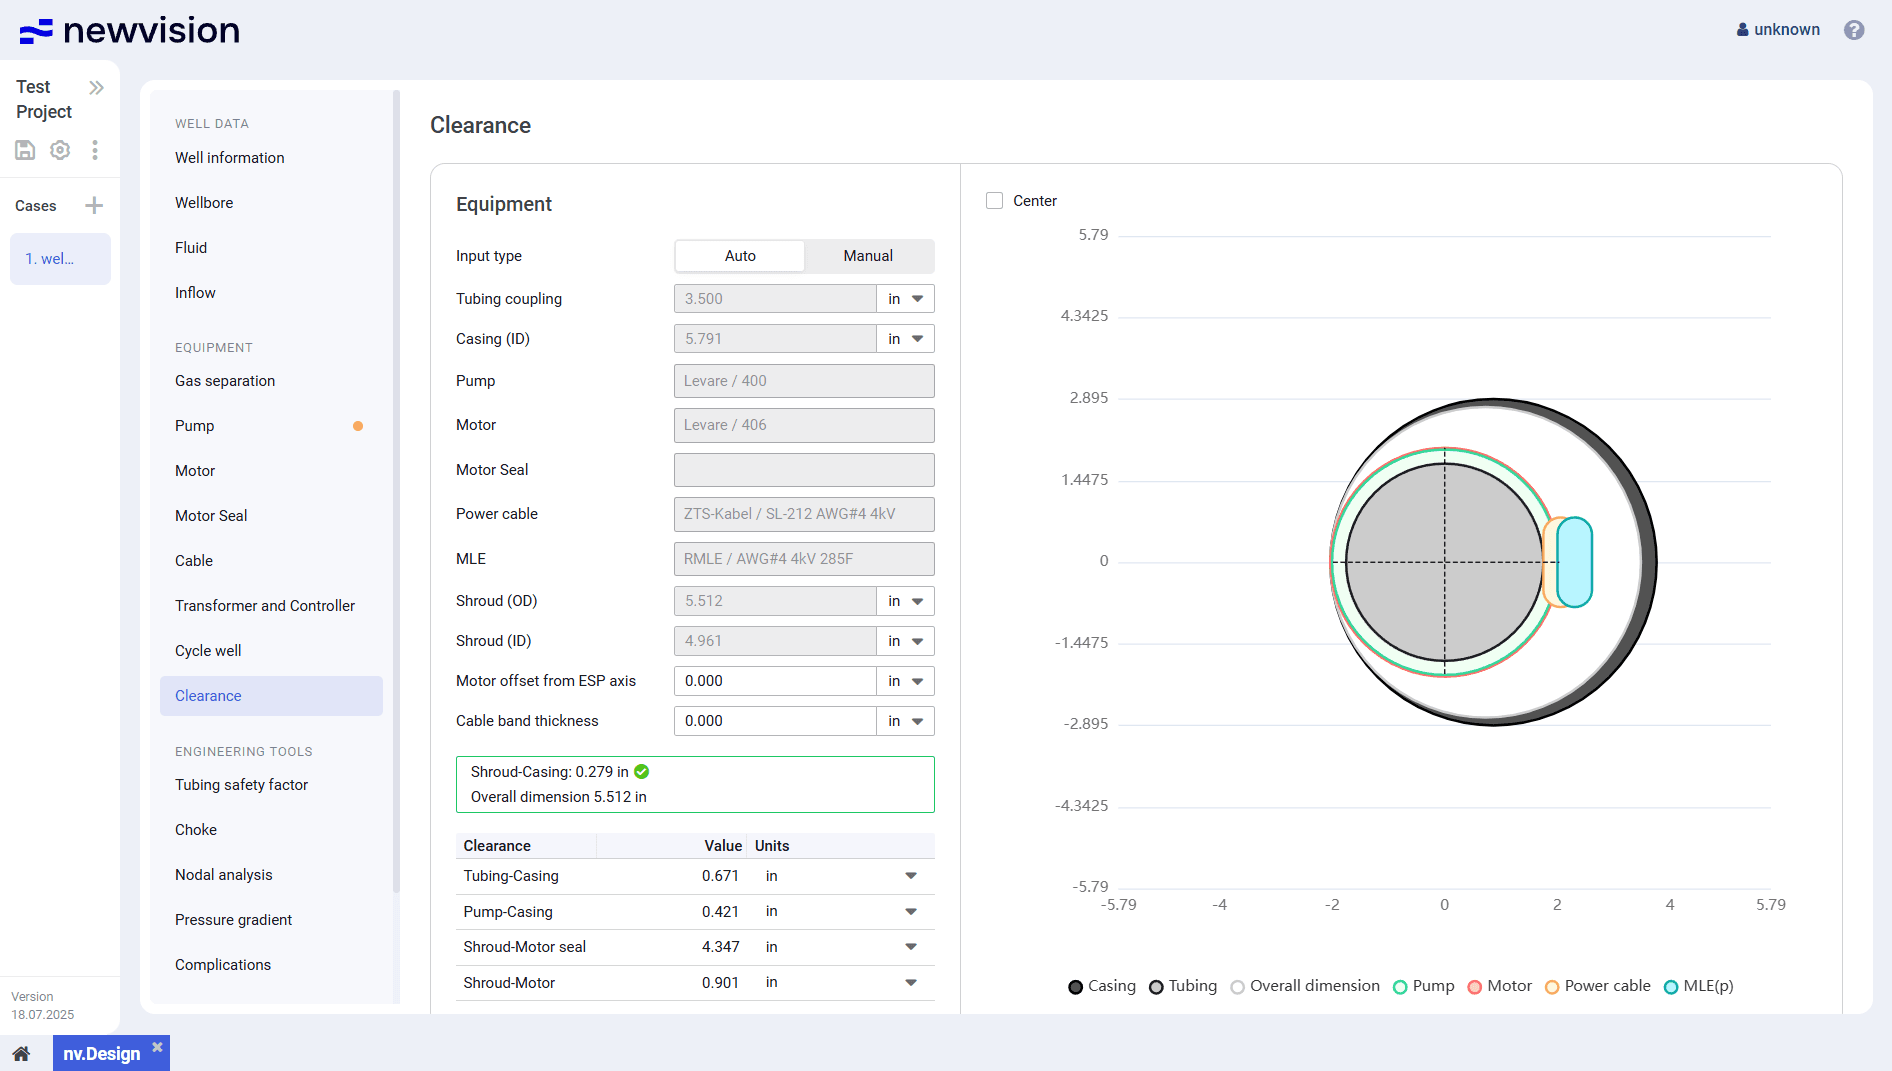
Equipment
The pane is divided into two parts:
- Equipment dimension data in the upper part of the pane.
- Clearance calculation results in the lower part of the pane.
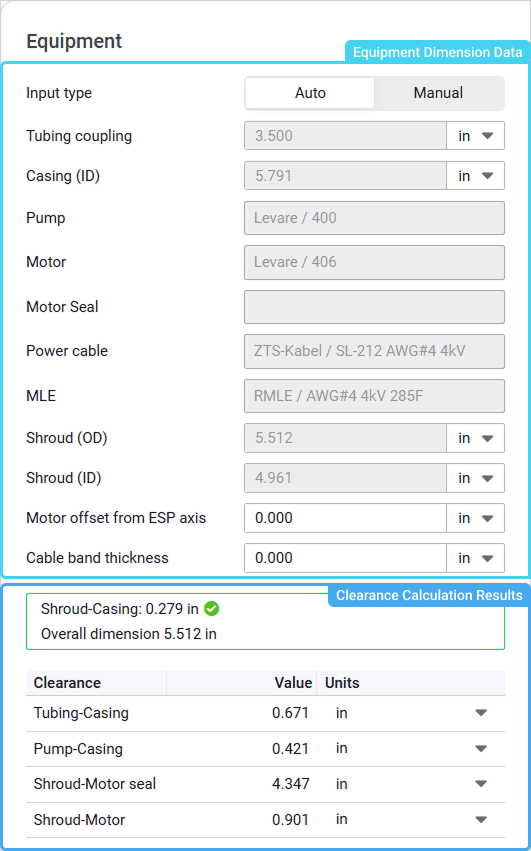
To select a method of the equipment dimension data input, select the desired option of the Input type parameter:
- Auto: Data is filled in automatically from other nv.design module sections.
- Manual: Data is entered manually to perform preliminary clearance checks to determine whether clearance values fall within acceptable limits even before detailed calculations are performed.
In the lower part of the pane, there is a table with the clearance calculation results.
At the top of the table, the summary data is displayed:
Equipment clearance: Minimum clearance between the assembly components (taken from the table below).
Green check mark ( ) next to the value indicates that the clearance is sufficient for feasibility and operational safety of the installation process.
Red cross ( ) means that the clearance is too small and must be fixed.
- Overall dimension: Maximum outer diameter of the entire assembly based on the equipment dimensions.
Visualization Pane
The pane contains a simplified layout of the ESP string inside the well.
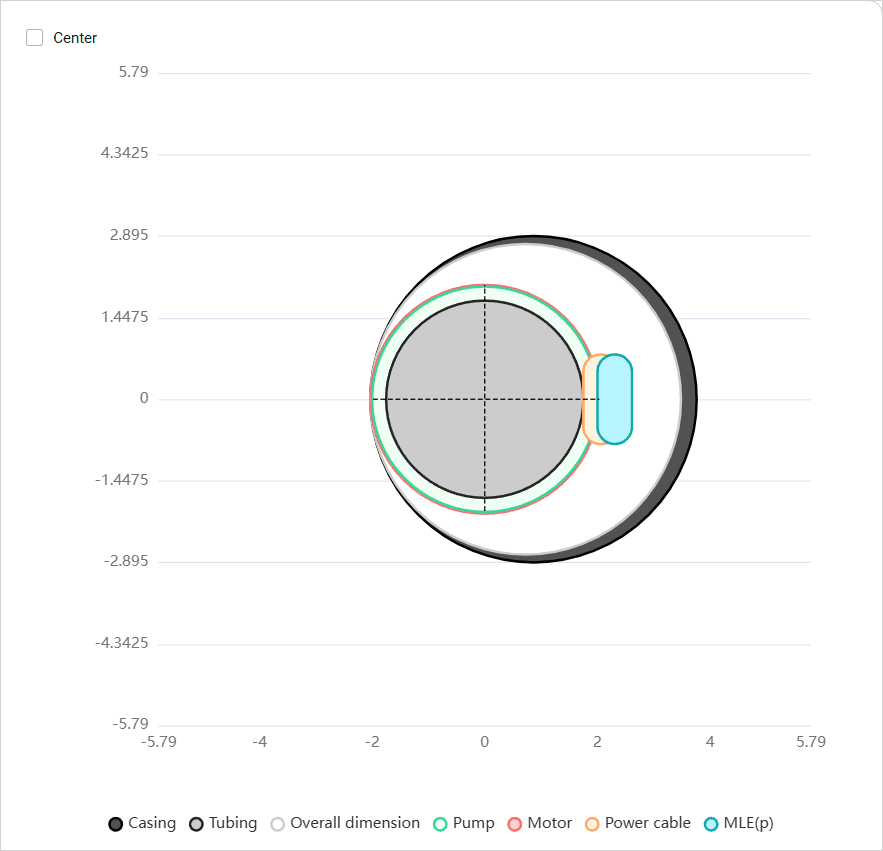
You can adjust the assembly layout to match the axis of the ESP and the production tubing to ensure proper placement and balance. To do this, in the upper-left corner of the pane, select the Center check box.
To show or hide a parameter on the layout, click the parameter name under it.