
The group consists of the following sections:
- Summary
- Detailed
Summary
The Summary section provides a comprehensive graphical representation summarizing all input data, calculation results, selected equipment, and performance characteristics.
It can be used as a final output document that you can export to PDF or print for documentation, review, or decision-making purposes.
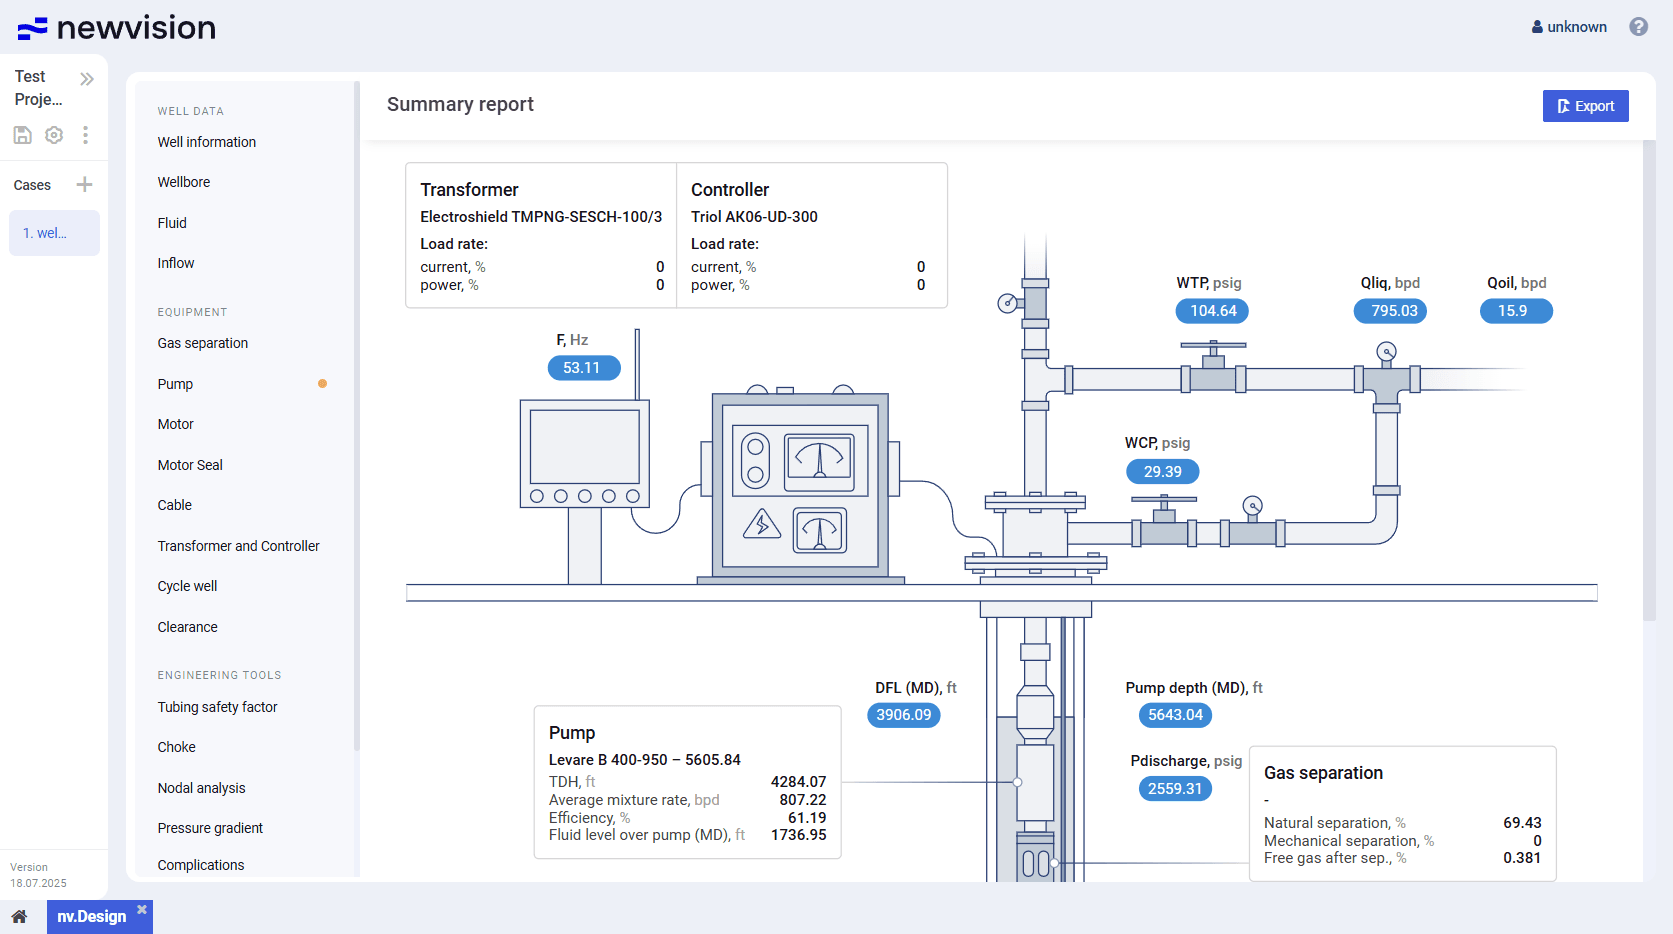
To export or print the report, in the upper-right corner of the report, click Export ( ), and then, in the standard browser window, select the desired action.

Detailed
The detailed report provides an in-depth breakdown of all user inputs, calculation results, selected models, and performance parameters for each section of the well configuration.
It includes tables, charts, equipment specifications, and calculation steps, making it suitable for technical review, auditing, and project documentation.
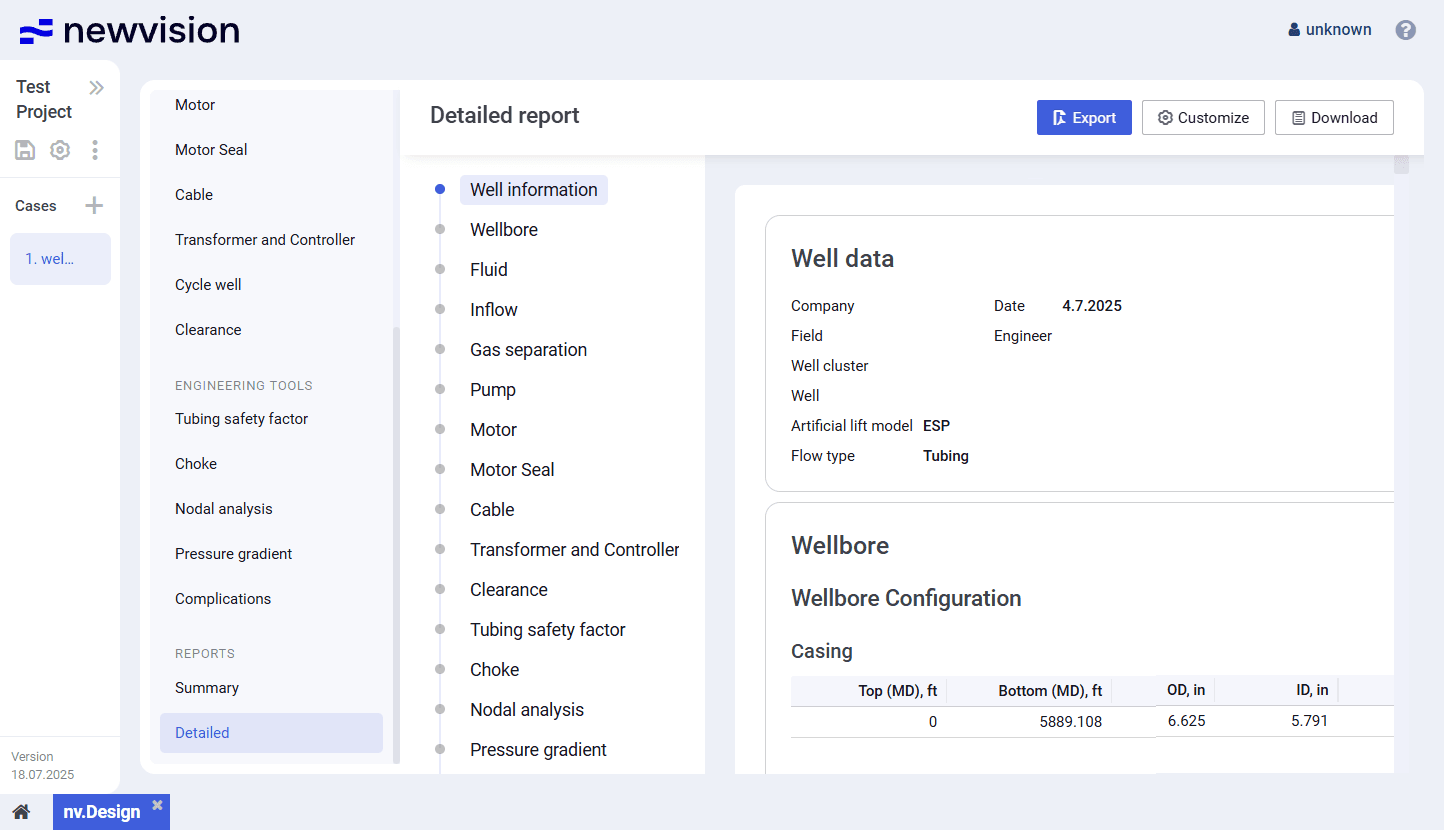
Well parameters in the report are organized into logical groups (sections). The list of sections is displayed in the left part of the report. You can navigate to the desired section by clicking its header in the list or by scrolling the report.
You can export the report to PDF and XLSX as well as print it.
To export the report to PDF or print it, in the upper-right corner of the report, click Export ( ), and then, in the standard browser window, select the desired action.
To export the report to XLSX, in the upper-right corner of the report, click Download ( ).

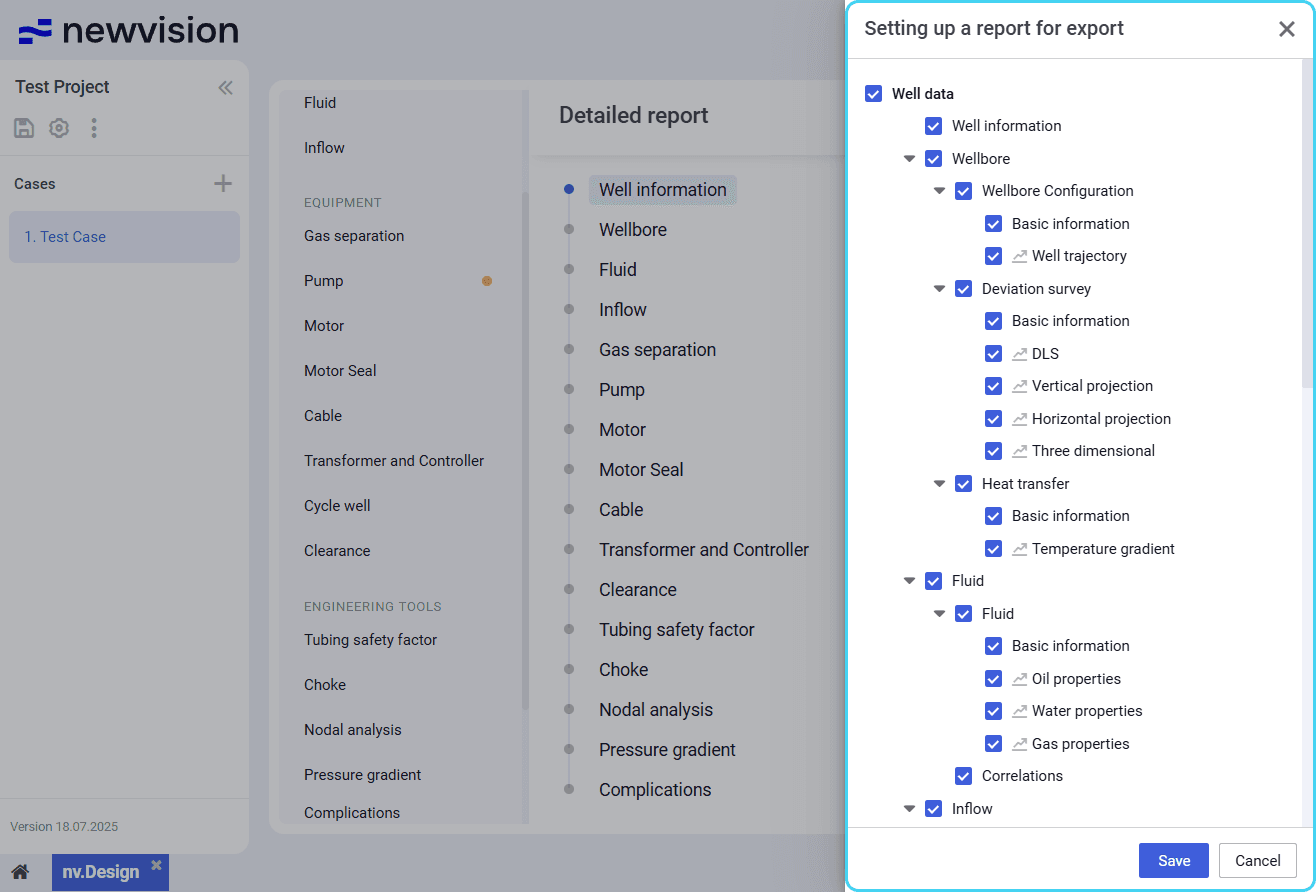
You can also configure the sections displayed in the report. To do this, in the upper-right corner of the report, click Customize ( ), and then, in the window that appears, select and/or clear check boxes of the sections that you want to show or hide in the report.

 | Note |